格陵蘭島絕大部分土地位在北極圈內,常態冰雪覆蓋面積約660,235平方英里(約171萬平方公里),約佔格陵蘭島總面積的80%,是次於南極的世界第二大冰棚,南北長約1,500英里(約2414公里),東西最寬處約680英里(約1094公里)。夏天時會有一部份冰雪消融,因為厚重的冰棚重量減輕,格陵蘭土地會稍微抬升0.59英吋(約15公釐)或多一些;等到冬天大量冰雪再次覆蓋大地,增加的重量又使土地稍微下降,如此年復一年,循環變化。
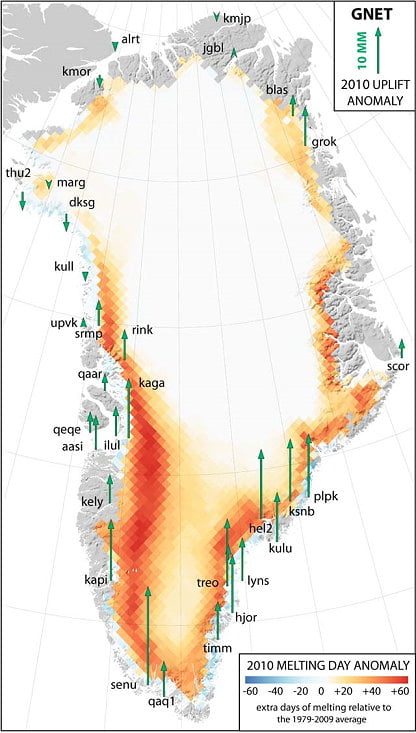
科學家在格陵蘭島沿岸設立了將近50個衛星定位站,建置一個衛星定位測量網絡(GPS Network ,GNET),監測格陵蘭島海岸線高度與積雪融化的關係,發現格陵蘭島南部在2010年夏天不尋常的融解了1千億噸的積雪,導致原本被壓在其下的海岸土地比往年夏天多抬升了1/4英吋(約6.4公釐),使得部分土地抬升了約0.79英吋(約20公釐)。
下圖是GPS監測站記錄2010年夏天格陵蘭島海岸因積雪大消退而抬升高度的變化:

Rising Greenland
Every year as the Greenland Ice Sheet melts, the rocky coast rises, explained Michael Bevis, Ohio Eminent Scholar in Geodynamics and professor in the School of Earth Sciences at Ohio State University. Some GPS stations around Greenland routinely detect uplift of 15 mm (0.59 inches) or more, year after year. But a temperature spike in 2010 lifted the bedrock a detectably higher amount over a short five-month period — as high as 20 mm (0.79 inches) in some locations.
“Pulses of extra melting and uplift imply that we’ll experience pulses of extra sea level rise,”he said. “The process is not really a steady process.”
Because the solid earth is elastic, Bevis and his team can use the natural flexing of the Greenland bedrock to measure the weight of the ice sheet, just like the compression of a spring in a bathroom scale measures the weight of the person standing on it.
Bevis is the principal investigator for the Greenland GPS Network (GNET), and he’s confident that the anomalous 2010 uplift that GNET detected is due to anomalous ice loss during 2010: “Really, there is no other explanation. The uplift anomaly correlates with maps of the 2010 melting day anomaly. In locations where there were many extra days of melting in 2010, the uplift anomaly is highest.” In scientific parlance, a melting day anomaly refers to the number of extra melting days — that is, days that were warm enough to melt ice — relative to the average number of melting days per year over several decades.
In 2010, the southern half of Greenland lost an extra 100 billion tons of ice under conditions that scientists would consider anomalously warm.
GNET measurements indicate that as that ice melted away, the bedrock beneath it rose. The amount of uplift differed from station to station, depending on how close the station was to regions where ice loss was greatest.
Southern Greenland stations that were very close to zones of heavy ice loss rose as much as 20 mm (about 0.79 inches) over the five months. Even stations that were located far away typically rose at least 5 mm (0.2 inches) during the course of the 2010 melting season. But stations in the North of Greenland barely moved at all.
There have been several recent major Greenland ice loss events:
A major ice loss to northern Greenland’s Petermann glacier occurred when the glacier lost 33 square miles (85 of floating ice between 2000 and 2001.
Between 2001 and 2005, a breakup of Sermeq Kujalleq erased 36 square miles from the ice field and raised awareness worldwide of glacial response to global climate change.
In July 2008, researchers monitoring daily satellite images discovered that a 11-square-mile piece of Petermann broke away.
For further information and photo: https://researchnews.osu.edu/archive/greenlift.htm
延伸閱讀:
在Google地球看北極冰域30年變遷,北極終將無冰?
本部落格「氣候變遷」專欄各文
您若喜歡本篇文圖,歡迎在文章末按「讚」,協助推廣。


