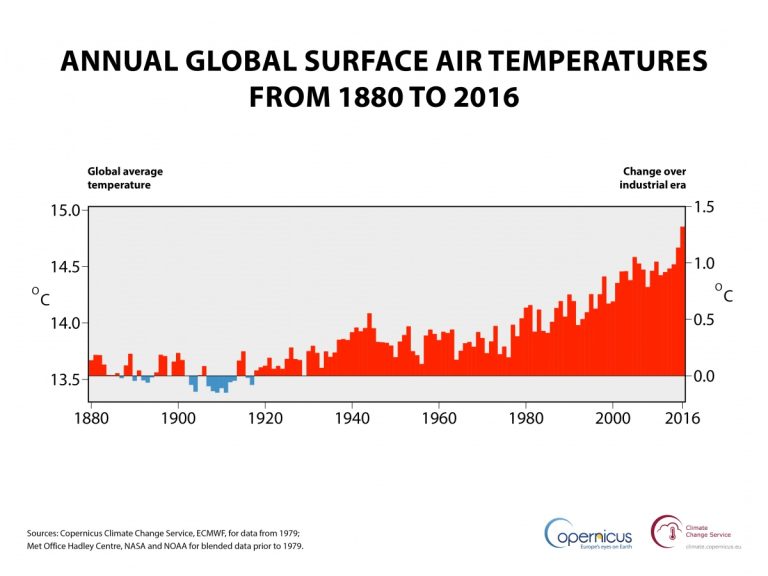
2016年11月14日,聯合國世界氣象組織(WMO)在摩洛哥的世界氣候高峰會(global climate summit in Morocco)宣布2016年將會是氣象史上最熱的一年,全球均溫將超過前工業時代1.2度C,是連續第三年創地球發燒溫度新高。
2016 will be the hottest year on record, UN says
World Meteorological Organisation figures show global temperature is 1.2C above pre-industrial levels and will set a new high for the third year running
Credit: Guardian News and Media
美國是消耗地球資源第一強國,新當選的總統川普卻揚言不相信有「氣候變遷」這碼事,想在上任後不理會聯合國2016年11月生效的人類生存的最後期望—「巴黎協議」(Paris Agreement),也就是美國將會繼續大量排碳,製造溫室氣體,讓地球愈來愈熱,只為圖美國人一時的享受。雖然事情還沒來,但確實令人擔心,地球環境真否會愈來愈惡化,愈來愈不適合人居,那人類要住到哪裡?
地球發燒,會帶來極端氣候,會影響生態系運作,會導致糧食生產困境,會造成冰川融解海水上漲,會引發氣候災民大遷移,會風不調雨不順,會國不泰民不安,會……有種種可預想的災難發生,所以要趕緊避免地球發燒,「巴黎協議」就是人類救亡圖存的最後一根海上稻草,如果連這可藉以攀附的稻草都要放棄,人類就要面對至少數百年生靈塗炭的日子,包括氣候災變、搶奪資源的戰爭、飢荒、缺水、流離失所,等到人類消滅到某一程度,地球不再受到人類荼毒,逐漸恢復正常氣候,環境與生態系也慢慢穩定,人類新世紀才可能再開始。
到底地球有沒有發燒?包括美國在內的許多科學研究機構都一再提出無數的證據說明地球確實發燒中,除了以衛星監控量測地表與海水溫度外,也以南北極冰域為最佳的監控目標,因為氣溫升高冰就融解,從冰的消融程度就可以判斷地球發燒嚴不嚴重。
2017年伊始,我以地球發燒及北極冰融最新狀況為例,來瞭解2016年的北極環境變化是如何牽動地球人未來的命運。以下整合美國航空暨太空總署(NASA)、美國海洋暨大氣總署(NOAA)及其2016北極年度報告(Arctic Report Card 2016)、美國氣候中心(CC)、美國冰雪數據中心(NSIDC)、歐洲太空總署(ESA)、英國氣象局(Met Office)歐洲哥白尼計畫氣候變遷服務(ECMWF, Copernicus Climate Change Service),加上媒體報導等資料,我們就來看北極冰域跟歷年比較,到底是走向健康還是走向死亡?
★ 美國海洋暨大氣總署(NOAA)及 2016北極年度報告摘要:

Credit: NOAA
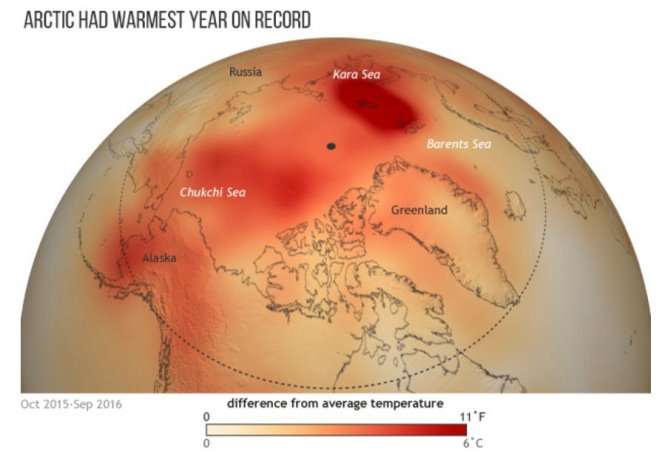
1.1900年開始有北極溫度紀錄以來,2016年9月底北極表面均溫是最高紀錄,而2016年的1月、2月、10月與11月也創下單月新高紀錄。The average surface air temperature for the year ending September 2016 is by far the highest since 1900, and new monthly record highs were recorded for January, February, October and November 2016.
2.37年來,格陵蘭島只有一年的春天融冰早於2016年。In 37 years of Greenland ice sheet observations, only one year had earlier onset of spring melting than 2016.
3.除了2013-2015海冰面積變化不大外,2016年夏天與2007年錄得的最低海冰量大致相仿,爲從1979年有紀錄以來第2低海冰量。After only modest changes from 2013-2015, minimum sea ice extent at the end of summer 2016 tied with 2007 for the second lowest in the satellite record, which started in 1979.
4.北冰洋是極易酸化的海域,因為海水溫度低於南方海域。本來就資源短缺的北極食物鏈,會使得海洋生態系因酸化而更脆弱。The Arctic Ocean is especially prone to ocean acidification, due to water temperatures that are colder than those further south. The short Arctic food chain leaves Arctic marine ecosystems vulnerable to ocean acidification events.
5.自1967年開始衛星監控以來,2016年北美北極圈春天積雪面積是最小的一次。Spring snow cover extent in the North American Arctic was the lowest in the satellite record, which started in 1967.
6.永凍層融解會排碳到大氣層,而綠化(長出植物)的凍原則會吸碳,不過依目前狀況,總的來說凍原是淨排碳到大氣中的。Thawing permafrost releases carbon into the atmosphere, whereas greening tundra absorbs atmospheric carbon. Overall, tundra is presently releasing net carbon into the atmosphere.
7.2015年10月到2016年9月間,北極年均溫是從1900年有觀測紀錄以來最高的一次。The average annual surface air temperature anomaly (+2.0° C relative to the 1981-2010 baseline) over land north of 60° N between October 2015 and September 2016 was by far the highest in the observational record beginning in 1900.
8.北極年均溫比20世紀時期升高攝氏3.5度,而2016年8月盛夏時節,科學家觀測到,巴倫支海(Barents)、楚科奇(Chukchi)及格陵蘭東西岸外海的海平面溫度,比1982至2010年的年平均溫度則提高了攝氏5度。This represents a 3.5° C increase since the beginning of the 20th Century. In August 2016, SST was up to 5° C higher than the 1982-2010 average in regions of the Barents and Chukchi seas and off the east and west coasts of Greenland.
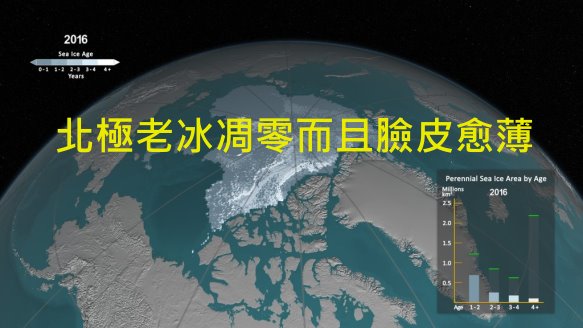
9. 1985年時,北極海近半海冰都是「萬年老冰」,但現在,北極只有22%是多年冰,其他都是才形成1年的新結冰。In March 2016, multiyear ice (more than 1 year old) and first-year ice were 22% and 78% of the ice cover, respectively, compared to 45% and 55% in 1985.
10.北極暖化速度是地球其他地區的2倍以上。Arctic air temperatures continue to increase at double the rate of the global temperature increase.
 Credit: NOAA
上圖顯示2015年10月至2016年9月是北極最熱的一年
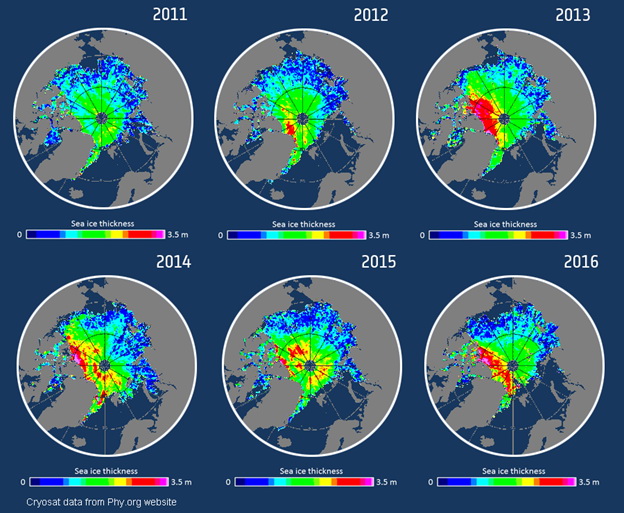 Credit: NOAA
上圖顯示2011-2016年之間11月的冰層厚度變化
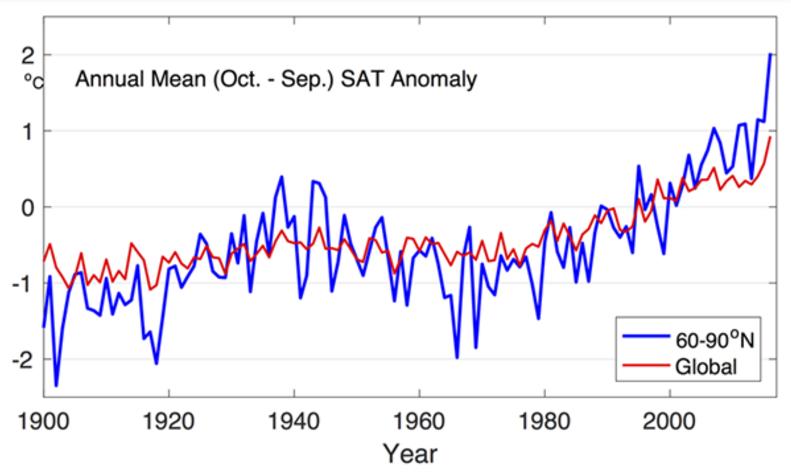 Credit: NOAA
上圖顯示2016年北極溫度是全球均溫2倍
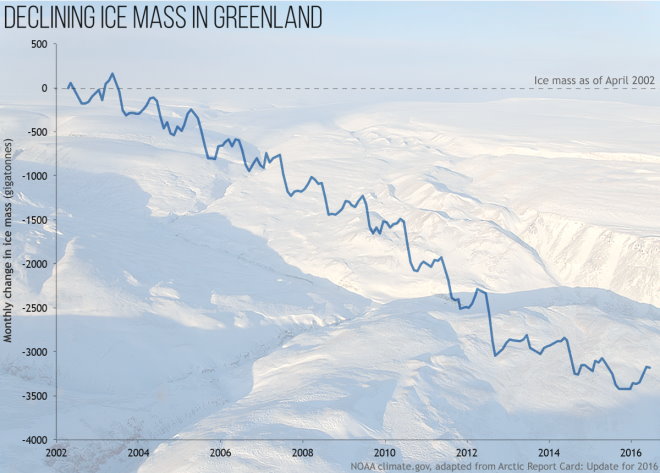 Credit: NOAA
上圖顯示格陵蘭島冰棚十多年來急速縮減
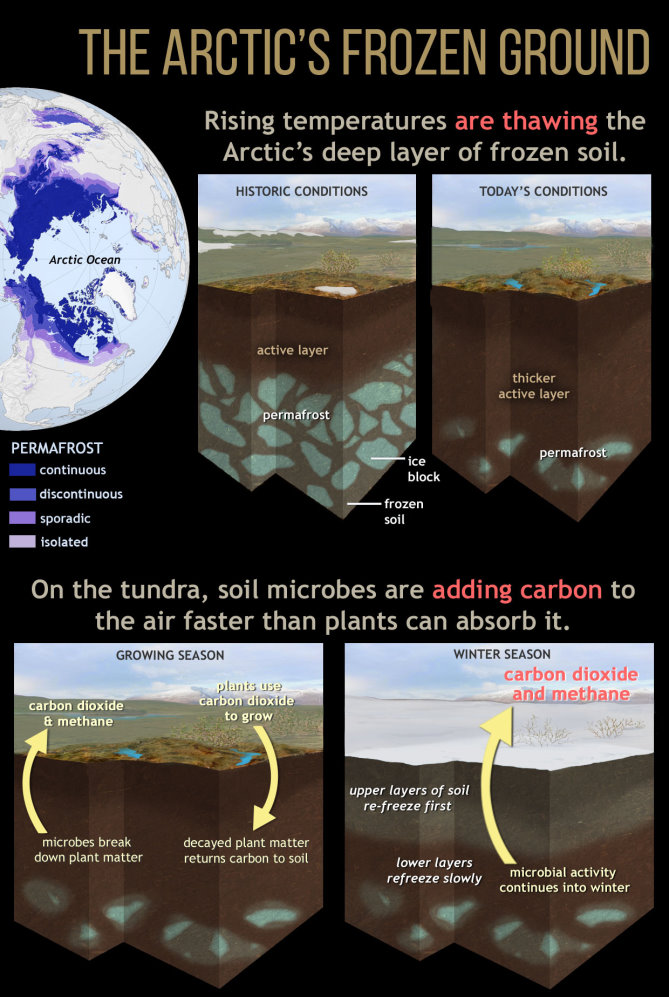 Credit: NOAA
上圖顯示北極永凍土愈來愈少,排碳愈來愈多。雖然暖化讓苔原增長植物,但植物吸碳的規模遠不及凍土消融所排碳的速度。
 Credit: NOAA
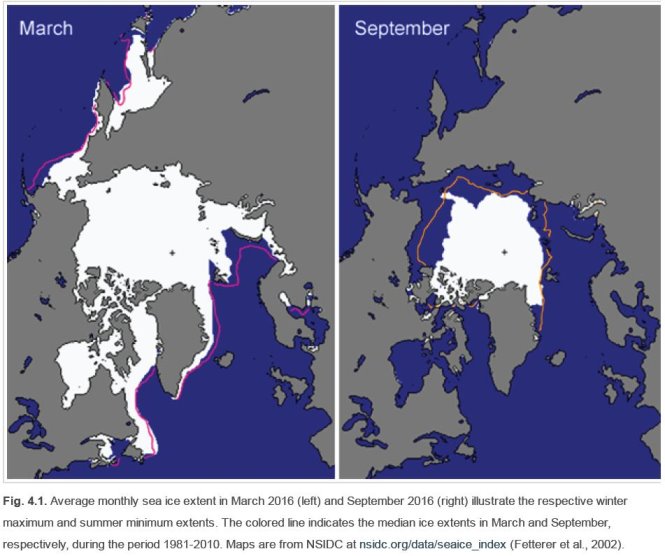
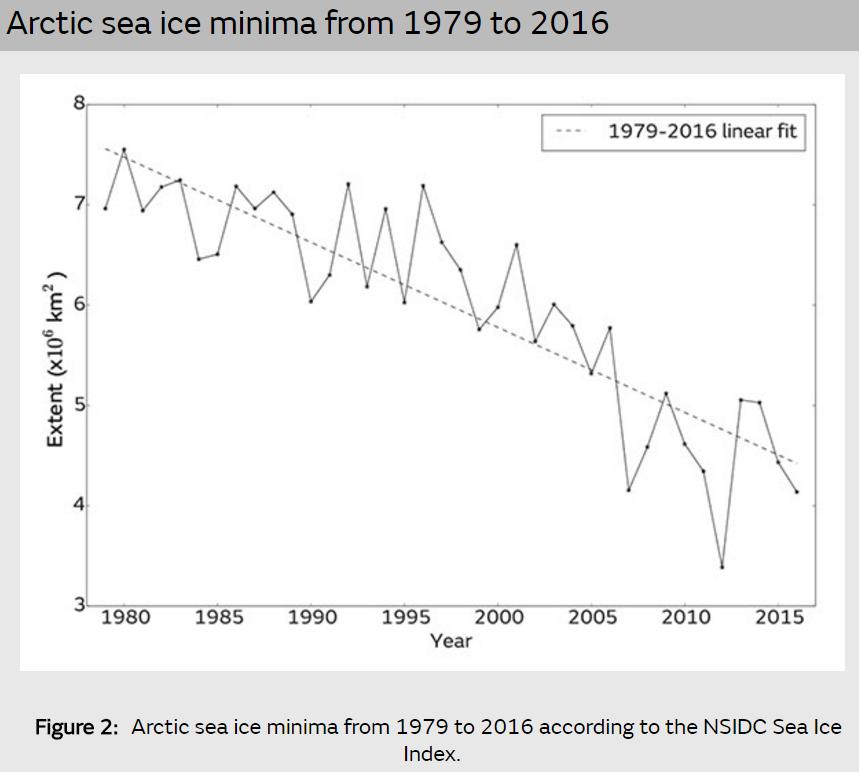
上圖顯示2016年9月10日,北極海冰覆蓋範圍達到當年最小面積414萬平方公里,與有紀錄以來2007年是第二小面積相當,與有紀錄以來最小面積第一名的2012年夏天面積339萬平方公里相比則多了75萬平方公里,但還是比1981-2010夏天平均最小面積少了181萬平方公里,相較2015夏天最小面積也少了29萬平方公里。2016年3月24日冬天最大範圍1452萬平方公里,與1981-2010的平均冬天最大面積相比少了7%。 Based on estimates produced by the National Snow and Ice Data Center (NSIDC) Sea Ice Index (Fetterer et al., 2002), the sea ice cover reached a minimum annual extent of 4.14 million km2 on September 10, 2016. This matched 2007 as the second lowest minimum extent in the satellite record. The 2016 summer minimum extent is larger by 0.75 million km2 (22%) than the record minimum of 3.39 million km2 set in 2012. It was, however, 1.81 million km2 (29%) less than the 1981-2010 average minimum ice extent and 0.29 million km2 (6.5%) less than the 2015 minimum.On March 24, 2016 ice extent reached a winter maximum value of 14.52 million km2, 7% below the 1981-2010 average.
Credit: NOAA
上面影片顯示從1990年到2016年11月上旬北極冰域老冰與新冰更替的情形,老冰(白色)愈多,表示北極冰域環境愈穩定,老冰愈少新冰(深藍)愈多,表示將來受到溫室效應的影響會愈大且愈快,融冰的速度也將加速。This animation tracks the relative amount of ice of different ages from 1990 through early November 2016. Seasonal ice is darkest blue. Ice that is 9 or more years old is white.
★ 英國國家廣播公司(BBC)2016/12/24報導:北極熱浪恐破紀錄(Arctic heatwave could break records)
2016年耶誕夜的北極氣溫,恐將高出平均溫度達20度。氣溫預報顯示,北極周邊耶誕夜的溫度將升達高峰—接近冰點。氣象科學家說,北極地區這些不合時令的溫暖天氣模式,直接與人為造成的氣候變遷有關。整個11月與12月的溫度,要比同期平均溫度高出攝氏5度。 Temperatures at the North Pole could be up to 20 degrees higher than average this Christmas Eve, in what scientists say is a record-breaking heatwave.Climate scientists say these unseasonably warm weather patterns in the Arctic region are directly linked to man-made climate change.Temperatures throughout November and December were 5C higher than average.
北極圈目前暖化的速度為全球暖化平均速度的兩倍,導致當地原住民難以打獵維生,並威脅北極熊等生物的生存。The Arctic region is warming at twice the global average, disrupting the hunting livelihoods of indigenous people and threatening creatures such as polar bears.
★ 美國冰雪數據中心(NSIDC)相關數據與圖表:
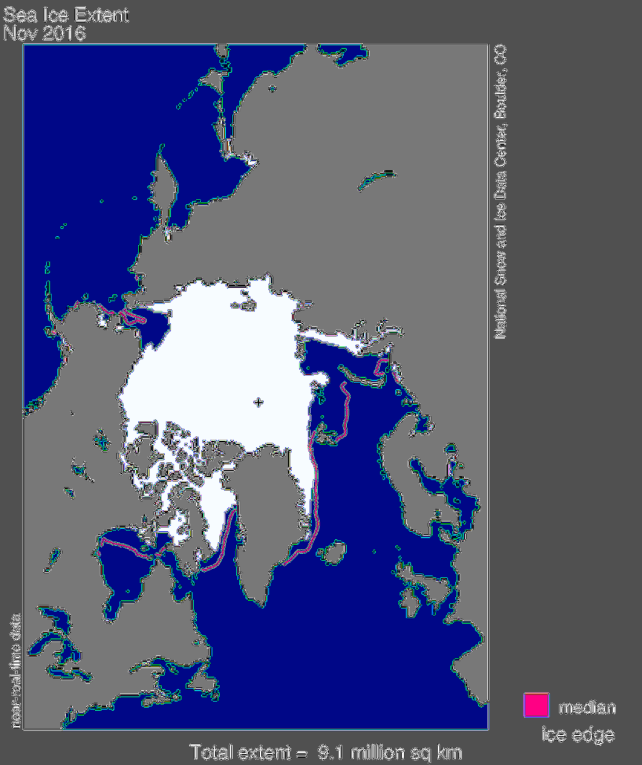
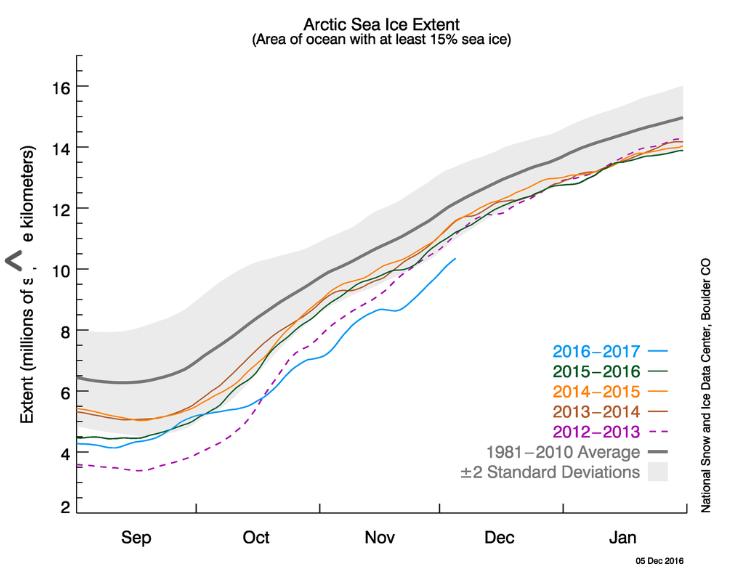
受到不尋常的高溫、南風以及溫暖的海水影響,2016年11月的北極冰範圍是歷來11月最小的。10月以來,北極冰域已較長期平均範圍少了超過二個標準差。南極冰域則於11月快速縮小,創下單月最小範圍紀錄,同樣較長期平均範圍少了超過二個標準差。整體來看,地球海冰確實異常的少了許多。Average Arctic sea ice extent for November set a record low, reflecting unusually high air temperatures, winds from the south, and a warm ocean. Since October, Arctic ice extent has been more than two standard deviations lower than the long-term average. Antarctic sea ice extent quickly declined in November, also setting a record low for the month and tracking more than two standard deviations below average during the entire month. For the globe as a whole, sea ice cover was exceptionally low.
 Credit: National Snow and Ice Data Center
2016年11月北極冰域範圍是908萬平方公里,是是有紀錄以來11月最小範圍。比之前2006年創下的最小紀錄更少了80萬平方公里,與1981-2010平均11月範圍相比也少了195萬平方公里。12月的冰域比長期平均值少了3.2個標準差。 In November 2016, Arctic sea ice extent averaged 9.08 million square kilometers (3.51 million square miles), the lowest November in the satellite record. This is 800,000 square kilometers (309,000 square miles) below November 2006, the previous lowest November, and 1.95 million square kilometers (753,000 square miles) below the 1981 to 2010 long-term average for November. For the month, ice extent was 3.2 standard deviations below the long-term average, a larger departure than observed in September 2012 when the Arctic summer minimum extent hit a record low.
 Credit: National Snow and Ice Data Center
上圖呈現北極冬天(9月至1月)海冰範圍比較,淺藍色線是2016-2017面積線,灰色線是1981-2010平均面積線,灰色區域是正負2個標準差範圍。可以看到從10月中之後到12月初本表製作時,北極海冰面積都遠小於其他年度,與1981-2010平均面積更是少於2個標準差。
 Credit: NSIDC courtesy NOAA/ESRL Physical Sciences Division
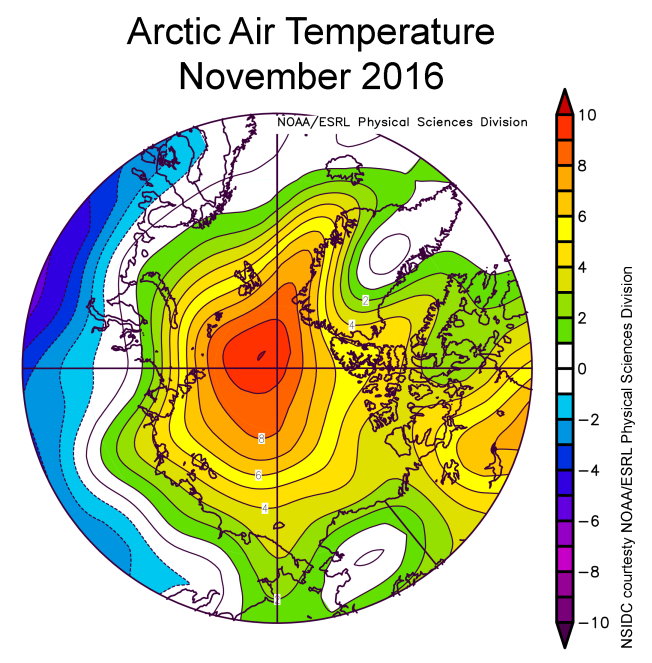
上圖顯示2016年11月北冰洋在925百帕氣壓(約海拔760公尺高)的氣溫都高於1981至2010年的平均溫度,而在北極點附件更是超出平均溫攝氏10度。但北歐亞地區的氣溫卻相反的低於平均溫度攝氏4-8度。This plot shows air temperature difference from average in the Arctic for November 2016. Air temperatures at the 925 hPa (approximately 2,500 feet) level in the atmosphere were above the 1981 to 2010 average over the entire Arctic Ocean and, locally up to 10 degrees Celsius (18 degrees Fahrenheit) above average near the North Pole. This is in sharp contrast to northern Eurasia, where temperatures were up to 4 to 8 degrees Celsius (7 to 14 degrees Fahrenheit) below average.
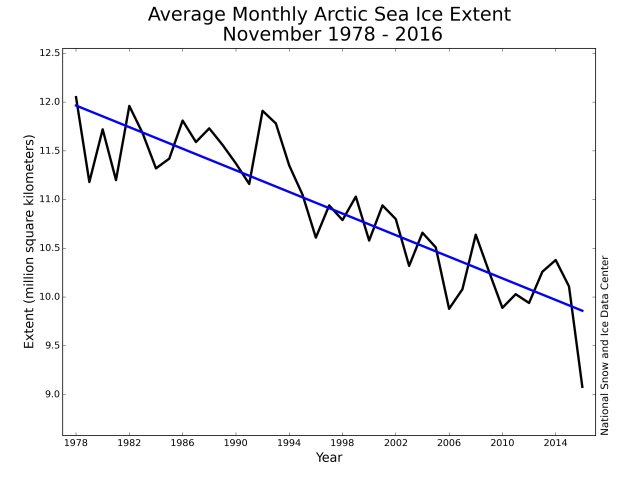 Credit: National Snow and Ice Data Center
上圖顯示1978-2016的每年11月北極海冰面積呈現縮小趨勢,由其斜率計算,每年消失了55400平方公里或是每十年減少5%的海冰。Through 2016, the linear rate of decline for November is 55,400 square kilometers (21,400 square miles) per year, or 5.0 percent per decade.
|
Year of September Average Extent 九月平均面積 |
Extent (million sq. km.) 百萬平方公里 |
Anomaly Relative to 1981-2010 Average (million sq. km.) 與1981-2010平均面積增減比較 |
Anomaly Relative to 1981-2010 Average (%) 與1981-2010平均面積增減百分比 |
Anomaly Relative to Previous Record (million sq. km.) 與前一年面積增減比較 |
Anomaly Relative to Previous Record (%) 與前一年面積增減百分比 |
Linear Trend Since 1979 (sq. km. per year) 1979年以來線性趨勢(每年平方公里) |
Linear Trend Since 1979 Relative to 1981-2010 Average (% per decade) 1979年以來與1981-2010平均線性趨勢比較(每十年百分比) |
|
2002 |
5.98 |
-0.56 |
-8.56 |
-0.20 |
-3.24 |
-48900 |
-7.47 |
|
2003 |
6.18 |
-0.36 |
-5.50 |
0.20 |
3.34 |
-50900 |
-7.78 |
|
2004 |
6.08 |
-0.46 |
-7.03 |
0.10 |
1.67 |
-52900 |
-8.08 |
|
2005 |
5.59 |
-0.95 |
-14.53 |
-0.39 |
-6.52 |
-57900 |
-8.85 |
|
2006 |
5.95 |
-0.59 |
-9.02 |
0.36 |
6.44 |
-58900 |
-9.00 |
|
2007 |
4.32 |
-2.22 |
-33.94 |
-1.27 |
-22.72 |
-70500 |
-10.77 |
|
2008 |
4.73 |
-1.81 |
-27.68 |
0.41 |
9.49 |
-76800 |
-11.74 |
|
2009 |
5.39 |
-1.15 |
-17.58 |
1.07 |
24.77 |
-77500 |
-11.85 |
|
2010 |
4.93 |
-1.61 |
-24.62 |
0.61 |
14.12 |
-80300 |
-12.27 |
|
2011 |
4.63 |
-1.91 |
-29.20 |
0.31 |
7.18 |
-83800 |
-12.81 |
|
2012 |
3.63 |
-2.91 |
-44.50 |
-0.69 |
-15.97 |
-91300 |
-13.95 |
|
2013 |
5.35 |
-1.19 |
-18.20 |
1.72 |
47.38 |
-88900 |
-13.60 |
|
2014 |
5.29 |
-1.25 |
-19.11 |
1.66 |
45.73 |
-86900 |
-13.28 |
|
2015 |
4.68 |
-1.86 |
-28.44 |
1.05 |
28.93 |
-87300 |
-13.35 |
|
2016 |
4.72 |
-1.82 |
-27.83 |
1.09 |
30.03 |
-87200 |
-13.33 |
|
September Average Extents, 2002-2016: Calculated by Walt Meier and Julienne Stroeve, National Snow and Ice Data Center. All values in table estimated based on the NSIDC Sea Ice Index. Figures here updated, October 2016. Note that these figures show September average extents rather than minimum extents. |
|||||||
Credit: NSIDC
上表呈現2002至2016年的每年9月(每年北極海冰最少的時候)平均面積,以及比較以往紀錄的增減。
The Arctic sea ice September minimum extent reached a new record low in 2012 of 3.41 million square kilometers, 44 percent below the 1981-2010 average, and 16 percent below the previous record in 2007. Over the last 13 years, a new record was set four times (2002, 2005, 2007, and 2012) and several other years saw near-record lows, particularly 2008 and 2011. On September 10, 2016, Arctic sea ice extent dipped to 4.14 million square kilometers, reaching a statistical tie with the 2007 minimum for second-lowest in the satellite record. As NSIDC reported in September 2016, the 10 lowest September ice extents over the satellite record have all occurred since 2007.
★ 美國氣候中心(Climate Central) 相關數據與圖表:
因為全球暖化,地球前17最高溫紀錄的年份有16個是在21世紀,只有1998年強烈聖嬰年的高溫紀錄落在20世紀。科學單位預測2017年的地表溫度將比1961-1990年平均溫度還高出攝氏0.63-0.87度之間。Because of global warming, 16 of the 17 hottest years on record have occurred this century, the only exception being the strong El Niño year of 1998.Forecasters expect 2017’s temperature to fall between 1.13°F (0.63 °C) and 1.57°F (0.87 °C) above the 1961-1990 average.
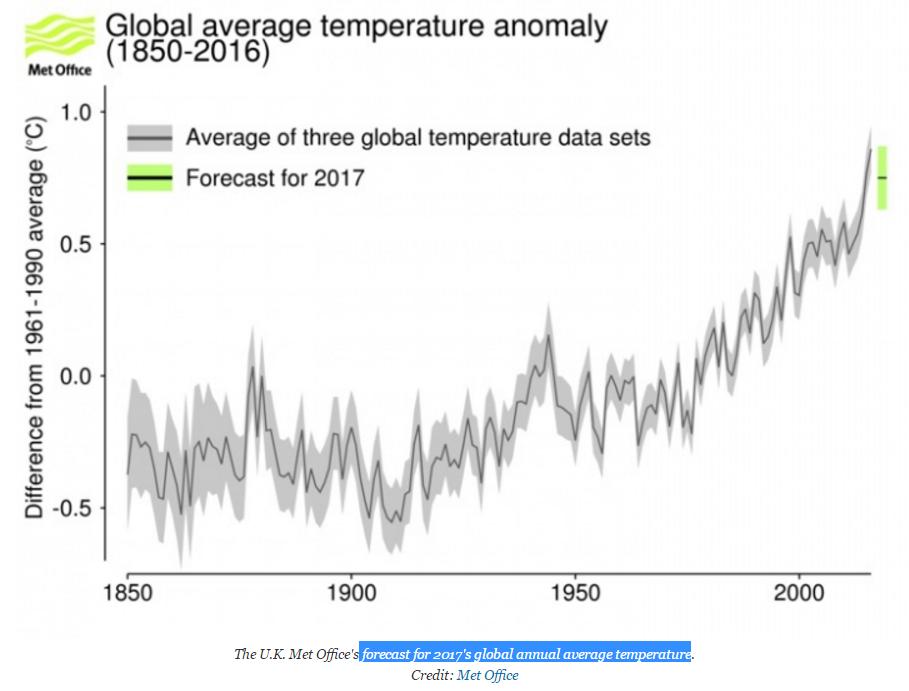 Credit: Climate Central
上圖顯示:1850-2016年地表溫度的升降變化,從20世紀末期就呈現一路飆高的情形,預估2017年的氣溫將比1961-1990間的平均溫度高出0.75度C。(灰線是英國氣象局(Met Office)、美國航空暨太空總署(NASA)、美國海洋暨大氣總署(NOAA)三項數據之平均值)
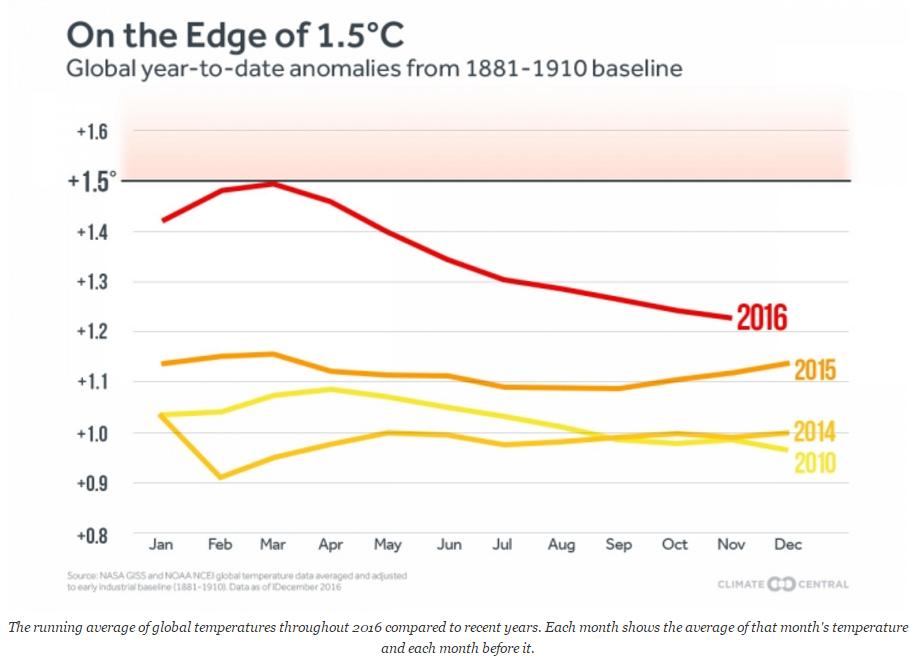 Credit: Climate Central
上圖顯示以1881-1910的平均溫度為基準,可以看到2016年12個月的氣溫都高出攝氏1.2度,甚至在3月的時候還差點突破1.5度C。(巴黎協議重點:所有簽署國家同意將地球氣溫上升的幅度,控制在與工業革命(1760年)前相比最多攝氏2度的範圍,且各國應努力追求讓升溫抑制在攝氏1.5度的更艱難目標。)
★ 英國氣象局(Met Office) 相關數據與圖表:

預估2017年仍然是非常溫暖的一年,不過因為聖嬰現象減弱,應該不會創造高溫紀錄。地表溫度將比1961-1990年平均溫度14度還高出攝氏0.63-0.87度之間,中間值約為0.75度。The Met Office global temperature forecast suggests that 2017 will be another very warm year globally but is unlikely to be a new record due to the absence of additional warming from El Niño.The global average temperature for 2017 is expected to be between 0.63 °C and 0.87 °C above the long-term (1961-1990) average of 14.0 °C, with a central estimate of 0.75 °C.
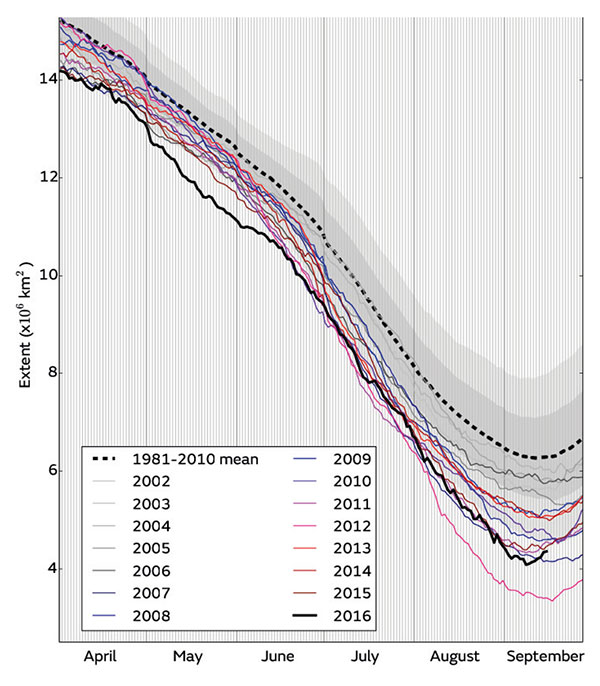 Credit: Met Office
上圖顯示北極2016年4-9月每日冰雪覆蓋面積的變化曲線,並與2002-2015各年的同月同日比較,也與1981-2010平均面積及正負2個標準差(灰色區)比較。Daily Arctic sea ice extent for 2016, compared with recent years, and the 1981-2010 average with +/- 1 and 2 standard deviation intervals indicated by the shaded areas. Data is from the National Snow and Ice Data Center (NSIDC)
 Credit: Met Office
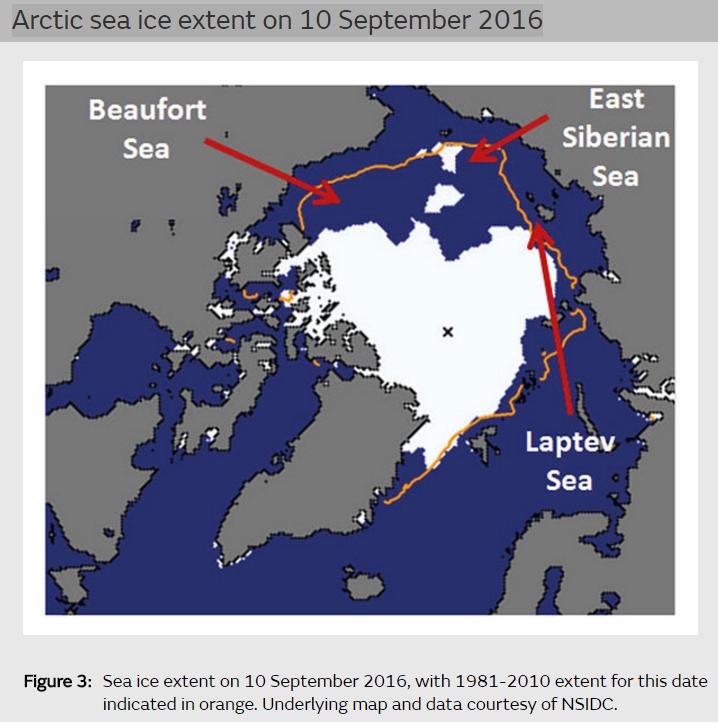
上圖顯示2016年9月10日當年度最小冰域範圍,橘色線是1981-2010冰雪覆蓋面積的中位數,紅色箭頭所指位在阿拉斯加北方的Beaufort海,是最早融解而且幾乎沒冰的區塊。另一位在西伯利亞北方的Laptev海,也是融得快光了,此乃夏天時低緯度的暖空氣不斷吹來之故。有一些分離的冰塊則漂流在處於這二個區塊間的東西伯利亞海域。This year, extent at minimum was particularly low in the Beaufort Sea north of Alaska, which is likely to be associated with a very early start to melting in this region. It was also very low in the Laptev Sea north of Siberia, due to frequent movement of warm air from lower latitudes over this region during the summer. Some patches of dispersed ice remained between these two regions, in the East Siberian Sea.
 Credit: Met Office
2016年9月10日當年度最小冰域面積是414萬平方公里,與2007年的415萬平方公里並列北極冰域有紀錄以來第二小面積,只比2012年排名第一最小面積的339萬平方公里多出75萬平方公里而已。This is the joint-2nd lowest minimum in the satellite record, virtually identical to the 4.15 million sq km recorded in 2007. It is 0.75 million square km above the record low extent of 3.39 million square km, which occurred in 2012.
|
Latest figures for WMO global average temperature anomaly (+/- 0.1 °C) compared to: |
||
|
Year |
1961 – 1990 average |
1981 – 2010 average |
|
2016 |
0.86 (Jan to Oct) |
0.55 (Jan to Oct) |
|
2015 |
0.77 |
0.46 |
|
2014 |
0.61 |
0.30 |
|
2013 |
0.54 |
0.22 |
|
2012 |
0.50 |
0.19 |
|
2011 |
0.46 |
0.15 |
|
2010 |
0.58 |
0.28 |
|
2009 |
0.52 |
0.21 |
|
2008 |
0.42 |
0.11 |
|
2007 |
0.51 |
0.20 |
|
2006 |
0.51 |
0.20 |
|
2005 |
0.56 |
0.25 |
|
2004 |
0.45 |
0.14 |
|
2003 |
0.51 |
0.20 |
|
2002 |
0.50 |
0.19 |
|
2001 |
0.44 |
0.13 |
|
2000 |
0.30 |
0.00 |
|
1999 |
0.31 |
0.00 |
|
1998 |
0.53 |
0.22 |
|
1997 |
0.39 |
0.08 |
Credit: Met Office
此表為聯合國世界氣象組織(WMO)統計從1997至2016年各年均溫與1961-1990及1981-2010之均溫比較,可以看見各年的均溫都高於這二種長期均溫(只有2000年與1981至2010均溫相當)。
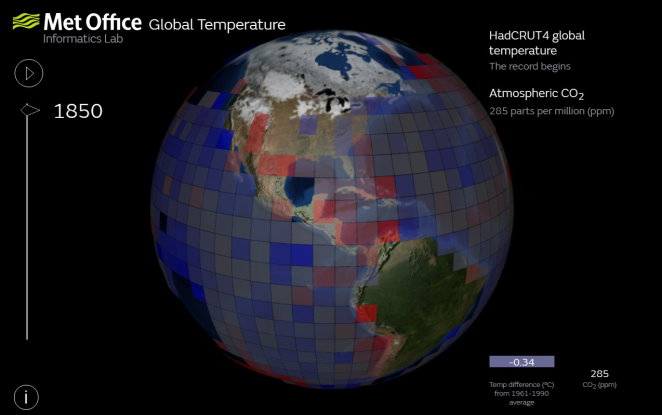
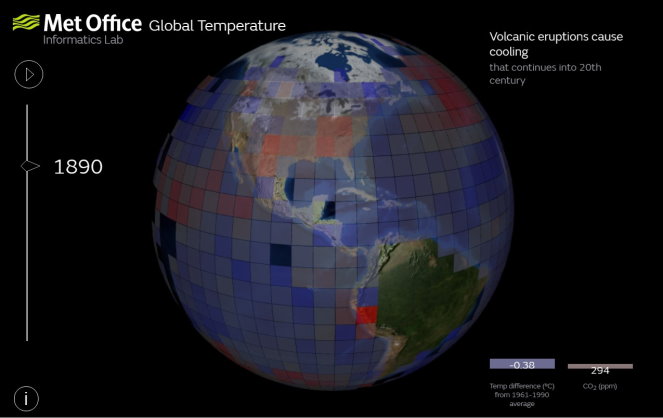
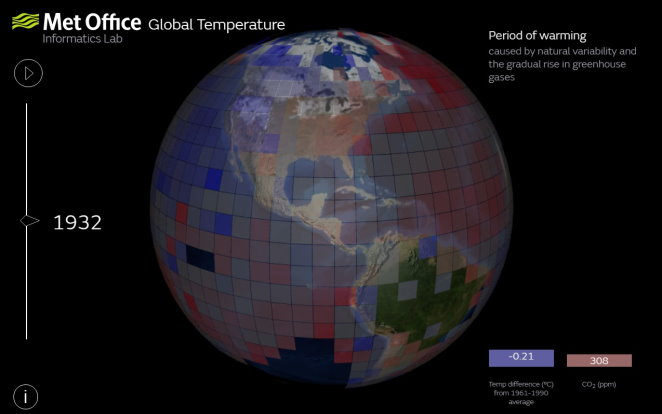
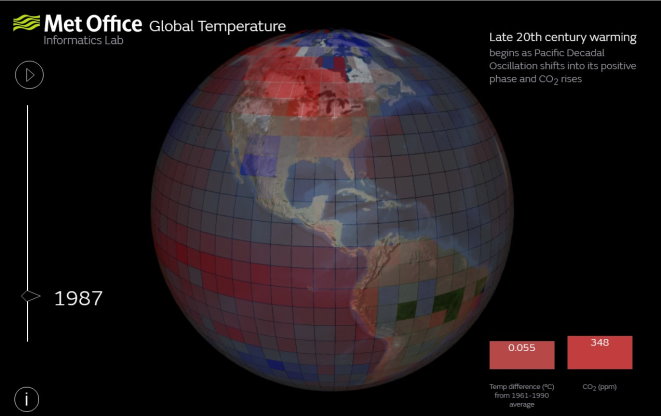
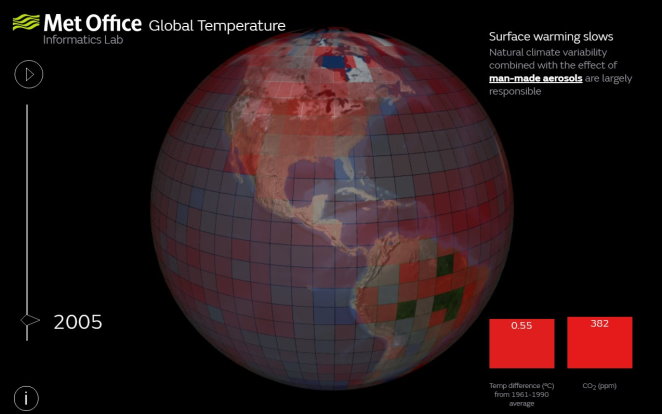
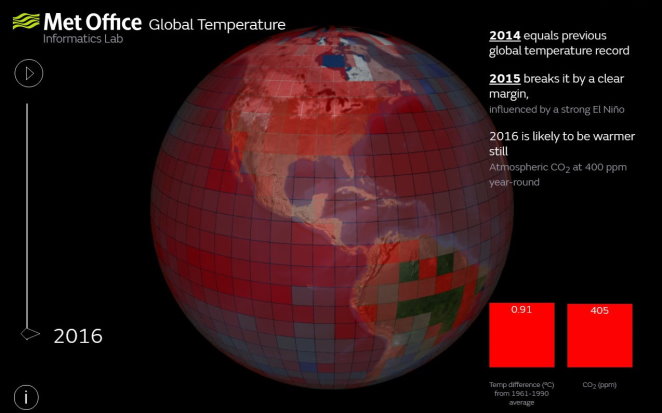
英國氣象局製作了一個網頁,視覺化看全球各地從1850年到2016年每年的溫度變化(右下角標出當年地球溫度高出長期均溫度數及排碳量),我擷取幾個畫面顯示地球發燒(愈來愈熱)的過程:
 Credit: Met Office
★ 美國航空暨太空總署(NASA)相關數據與圖表:
地球曾有多次氣候變遷的歷史,在之前65萬年間有七次冰河時代,來了又退,在七千年前忽然結束了最近一次的冰河期,開啟了新的氣候時代及人類文明。過去這些氣候變化主要歸因於地球軌道的微小變化,使得太陽能源的照射量或地球接收量改變所致。The Earth’s climate has changed throughout history. Just in the last 650,000 years there have been seven cycles of glacial advance and retreat, with the abrupt end of the last ice age about 7,000 years ago marking the beginning of the modern climate era — and of human civilization. Most of these climate changes are attributed to very small variations in Earth’s orbit that change the amount of solar energy our planet receives.
但現在的地球暖化卻很明顯的肇因於人為引發,而且在過去1300年間以空前的速度進展著。The current warming trend is of particular significance because most of it is very likely human-induced and proceeding at a rate that is unprecedented in the past 1,300 years.
海平面上升、全球溫度上升、溫暖的海洋、冰棚縮減、北極海冰減少、冰河消退、氣候災變、海洋酸化及冰雪量減少等都是氣候變遷的證據。The evidence for rapid climate change is compelling:Sea level rise, Global temperature rise , Warming oceans, Shrinking ice sheets, Declining Arctic sea ice, Glacial retreat, Extreme events, Ocean acidification, Decreased snow cover。(各證據詳情請點閱:https://climate.nasa.gov/evidence/)


Credit: NASA
上圖顯示2017年1月1日全球二氧化碳量為404.93ppm,全球均溫高於1880年來均溫華氏1.7度(攝氏-16.83度),北極冰域夏季最小面積量每十年減少13.3%,陸地積冰量每年減少2千8百10億噸,海平面每年上升3.4公釐。
 Credit: NASA (Vostok ice core data/J.R. Petit et al.; NOAA Mauna Loa CO2 record.)
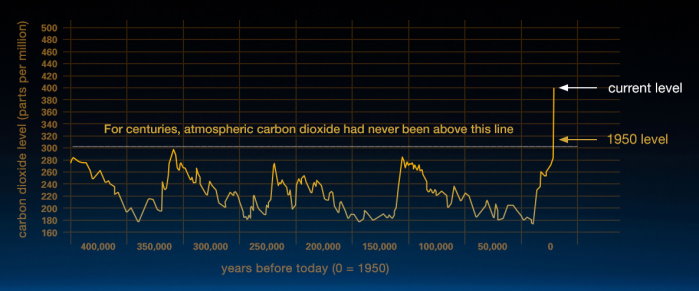
上圖顯示目前全球排碳量,圖中間灰色橫線是1950年的排碳量。
 Credit: NASA
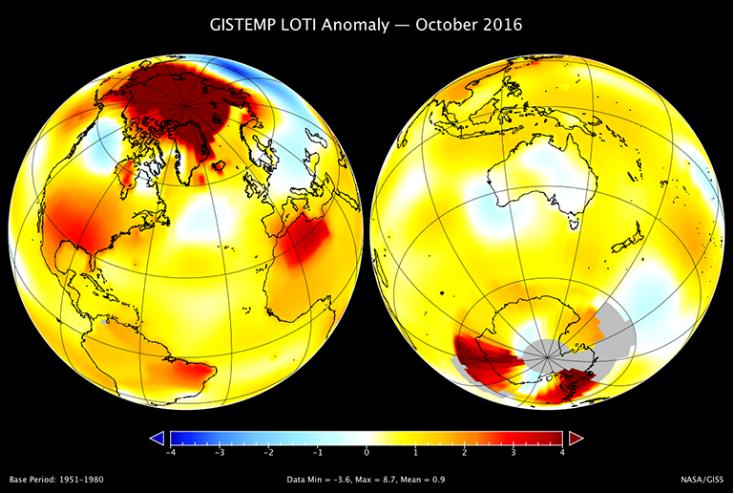
2016年10月是10月史上第二高溫,史上10月最高溫的前三名是2015、2016及2014。前10名最高溫10月都在21世紀。October 2016 was the second warmest October in 136 years of modern record-keeping, according to a monthly analysis of global temperatures by scientists at NASA’s Goddard Institute for Space Studies (GISS) in New York.
October 2016’s temperature was 0.18 degrees Celsius cooler than the warmest October in 2015. Last month was 0.89 degrees Celsius warmer than the mean October temperature from 1951-1980.
The top three October temperature anomalies have been the past three years. 2015 was the hottest on record, 1.07 degrees Celsius warmer than the October mean temperature, followed by 2016 and 2014. The top 10 October temperature anomalies all have occurred since 2000.
 Credit: NASA
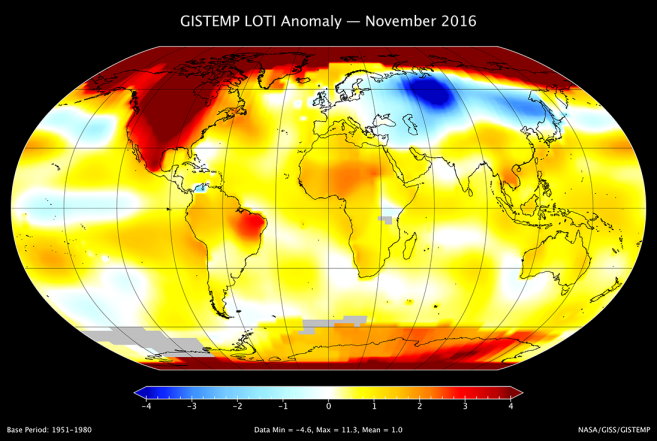
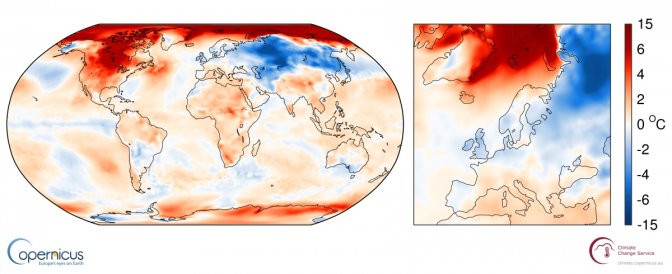
上圖顯示2016年的11月,北美尤其是北極圈溫度高於世界均溫甚多,但同時間的中俄溫度則遠低於常溫。A map of the November 2016 LOTI (land-ocean temperature index) anomaly, showing that North America and especially the Arctic region were much warmer than average. Meanwhile central Russia was colder than normal.
 Credit: NASA
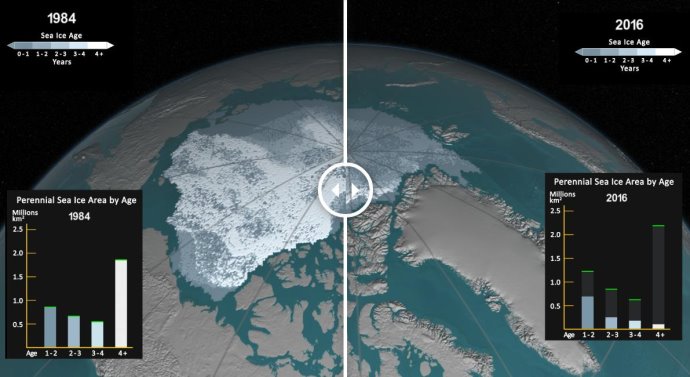
上圖是1984年與2016年9月冰層年齡比較:1984年時4年以上的冰(白色)面積非常廣,將近200萬平方公里;2016年時4年以上的冰比例最少,面積只剩大約10萬平方公里。
Credit: NASA
上面影片顯示1984至2016年每週各年齡冰層增消動態 Weekly Arctic sea ice age between 1984 and 2016.
★ 歐洲太空總署(ESA)相關數據與圖表:
 Credit: ESA Copyright: University of Hamburg
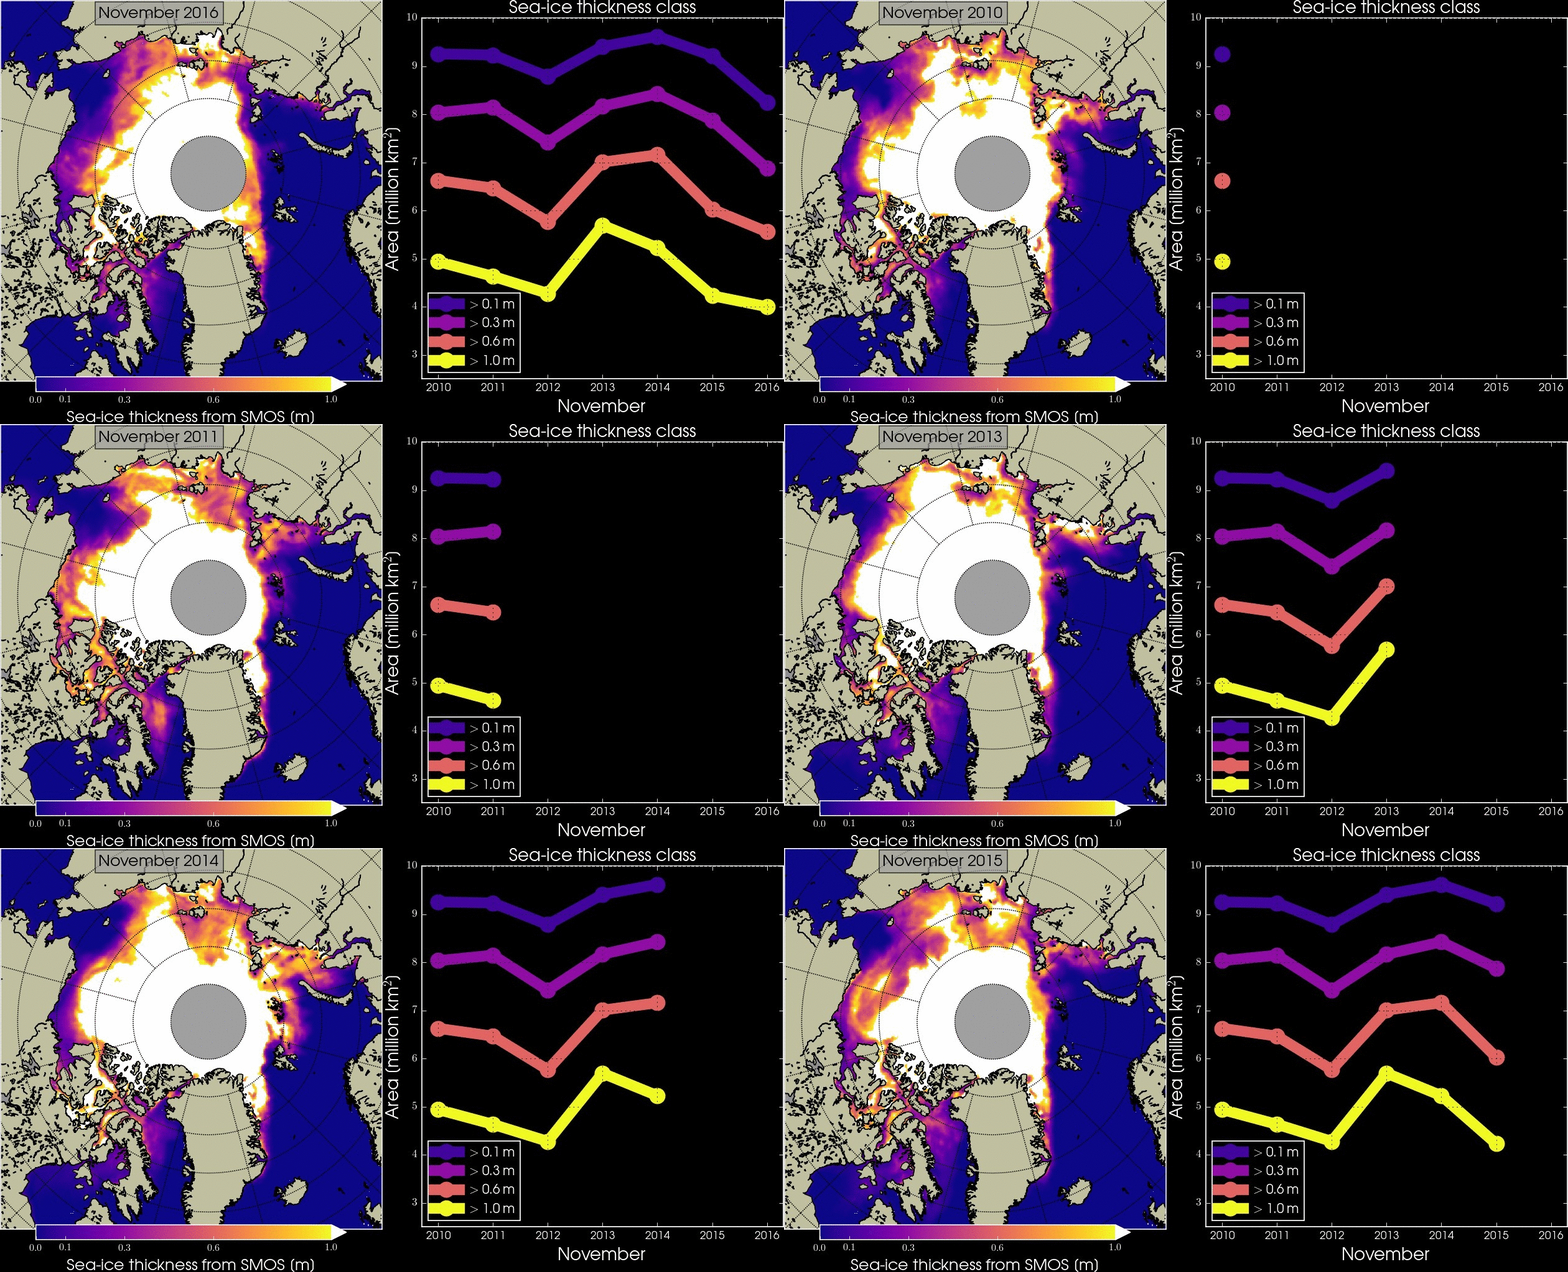
上圖顯示不同厚度的冰面積在2010-2016年每年11月增減的情形,黃色線為厚度超過1公尺的冰,粉紅色線為厚度超過60公分未達1公尺的冰,洋紫色線為厚度超過30公分未達60公分的冰,紫色線為厚度超過10公分未達30公分的冰。Based on measurements from the SMOS mission, the animation shows changes in sea-ice thickness during November between 2010 and 2016. Although designed to improve our understanding of Earth’s water cycle, SMOS is now being used to provide accurate measurements of thin sea-ice, complementing the CryoSat mission.
Credit: ESA/CPOM/UCL/D Sandwell/Planetary Visions
上面影片顯示南極、格陵蘭島及北冰洋冰量的變化,也顯示全球海洋的深度。This animation shows changes in ice volume in Antarctica, Greenland and the Arctic ocean measured by the CryoSat satellite, 2010–15. CryoSat’s readings also contribute to our knowledge of global ocean depth.
★ 澳洲媒體Bussiness Insider報導二部有關極區冰雪研究的影片:
Credit: BI Science
上面影片顯示如果地球上的冰都融解,將會淹沒哪些地方?What the Earth would look like if all the ice melted?
Credit: BI
上面影片顯示哈佛大學研究指出極區的冰雪融解,海水會流向低緯度,增加赤道的重量,這會使得地球自轉變慢,一天多了5豪秒,這是好事嗎?The impact of climate change extends beyond just the weather. According to Harvard University researchers, melting glaciers at the poles are slowing down the Earth’s rotation, and as a result, increasing the length of our days.
★ 歐洲哥白尼計畫氣候變遷服務(ECMWF, Copernicus Climate Change Service)相關數據與圖表:
 Credit: ECMWF, Copernicus Climate Change Service
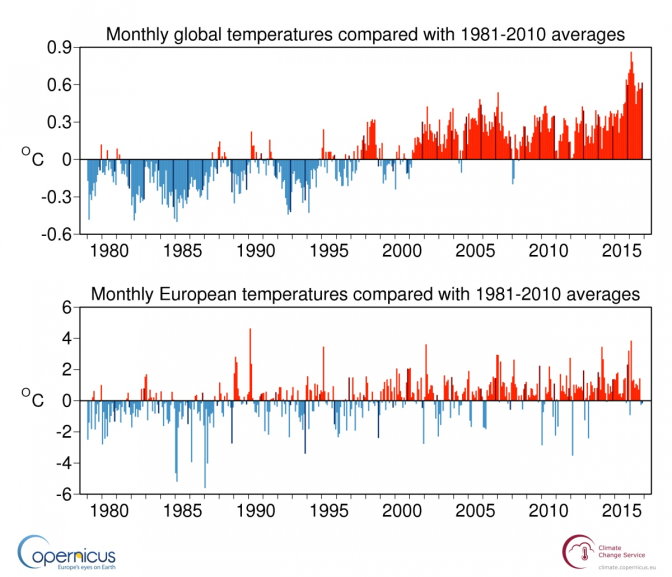
上圖顯示全球(上半圖)與歐洲(下半圖)從1980至2016年月均溫跟1981-2010均溫比較,黑色直線是每年的11月溫度線。Monthly global-mean and European-mean surface air temperature anomalies relative to 1981-2010, from January 1979 to November 2016. The darker coloured bars denote the November values.
 Credit: ECMWF, Copernicus Climate Change Service
上圖顯示2016年的11月,北美尤其是北極圈溫度高於世界均溫甚多,但同時間的中俄溫度則遠低於常溫。Surface air temperature anomaly for November 2016 relative to the November average for the period 1981-2010.
 Credit: ECMWF, Copernicus Climate Change Service
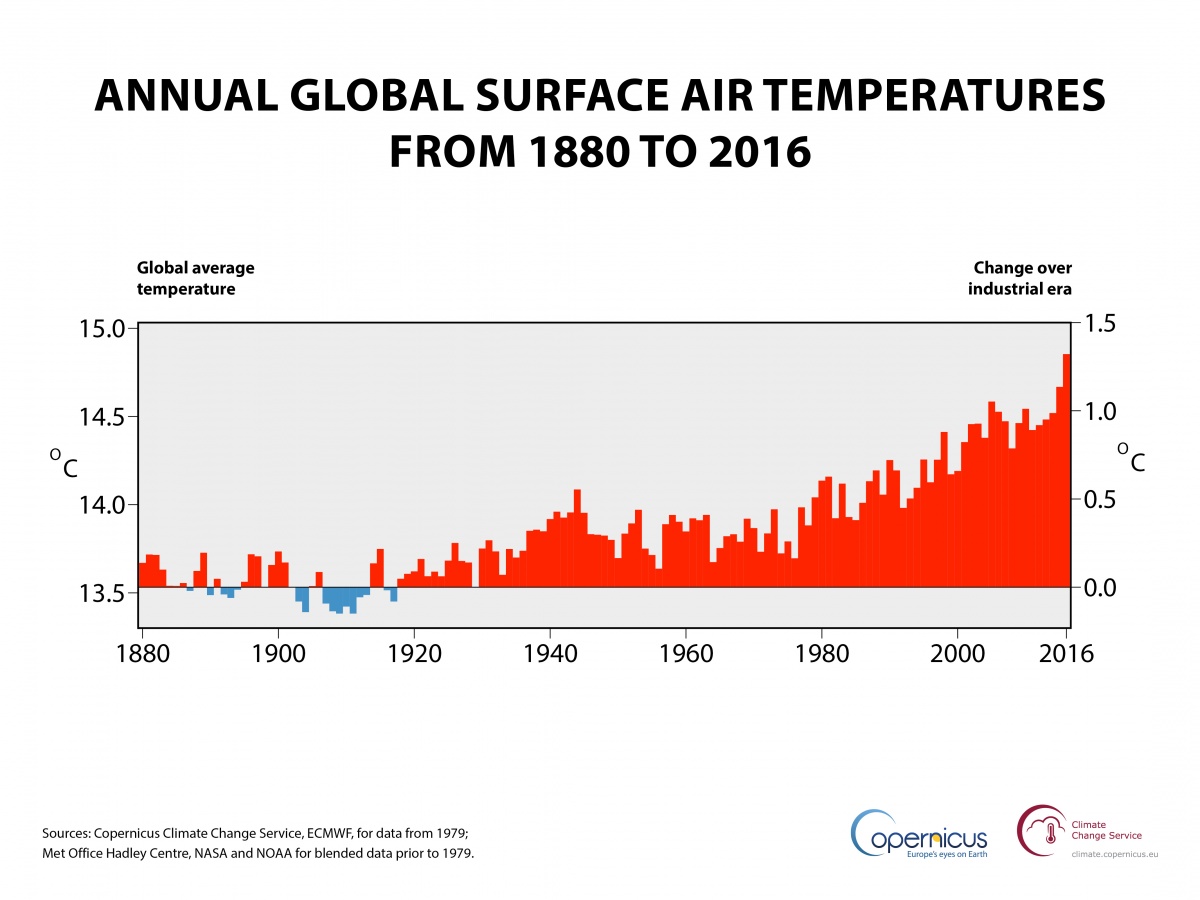
上圖顯示2016年全球均溫以極大幅度再創紀錄,較工業時代前高出攝氏1.3度,直逼巴黎氣候峰會為限制全球暖化而設下的增溫上限1.5度。
看了以上我花了很多時間彙整的科學資料,請大家想想,「氣候變遷」、「地球暖化」、「溫室效應」等現象名詞是正在發生的事件還是假象?我們再想想,如果正在發生而我們不做任何處置,哪些人會得到好處? 哪些人會遭殃?如果正在發生而我們積極處置,哪些人會得到好處? 哪些人會遭殃?如果確如川普所言那是假的訊息,根本沒有這回事,大家繼續過以前的生活模式,那麼又是哪些人會得到好處? 哪些人會遭殃?
最後請再想想,我們現在及要給後代子孫過怎樣的日子?如果不想要面臨地球暖化帶來的各種災難,我們該怎麼做?可以怎麼做?
延伸閱讀:
本網誌「氣候變遷」專欄各文

