
摘錄自2014年12月24日人民網報導
據英國廣播公司(BBC)報道,美國國家航空航天局(NASA)的嗅碳衛星「軌道碳觀測者2號」(OCO-2)已傳回了它的首張全球二氧化碳地圖。
這顆衛星於今年7月發射升空,主要任務是幫助確定二氧化碳在地球表面的哪些關鍵地點被排放和吸收。這將有助於科學家更好地瞭解人類活動對氣候的影響。
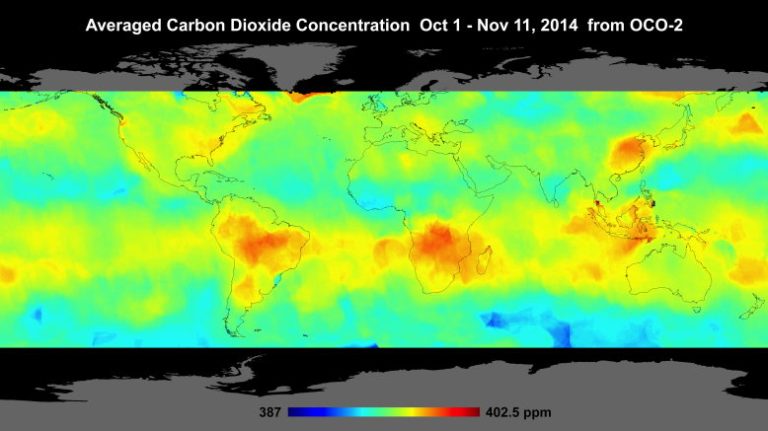
研究人員在舊金山舉行的美國地球物理聯合會秋季會議上展示了這幅地圖。圖表中顯而易見的是一種「成條效應」,即排放出的二氧化碳氣體隨著風沿緯度混合在一起形成「條帶」狀。
同樣明顯的是,南美洲和非洲南部上空的二氧化碳濃度更高,可能是這些地區燃燒生物質的結果。此外,美國東海岸和中國全境的碳排放也較高,這主要是因為排工業化產生的額外二氧化碳造成的。
底下是NASA新聞稿原文:
The first global maps of atmospheric carbon dioxide from NASA’s new Orbiting Carbon Observatory-2 mission demonstrate its performance and promise, showing elevated carbon dioxide concentrations across the Southern Hemisphere from springtime biomass burning.
At a media briefing today at the American Geophysical Union meeting in San Francisco, scientists from NASA’s Jet Propulsion Laboratory, Pasadena, California; Colorado State University (CSU), Fort Collins; and the California Institute of Technology, Pasadena, presented the maps of carbon dioxide and a related phenomenon known as solar-induced chlorophyll fluorescence and discussed their potential implications.
A global map covering Oct. 1 through Nov. 17 shows elevated carbon dioxide concentrations in the atmosphere above northern Australia, southern Africa and eastern Brazil.
“Preliminary analysis shows these signals are largely driven by the seasonal burning of savannas and forests,” said OCO-2 Deputy Project Scientist Annmarie Eldering, of JPL. The team is comparing these measurements with data from other satellites to clarify how much of the observed concentration is likely due to biomass burning.
The time period covered by the new maps is spring in the Southern Hemisphere, when agricultural fires and land clearing are widespread. The impact of these activities on global carbon dioxide has not been well quantified. As OCO-2 acquires more data, Eldering said, its Southern Hemisphere measurements could lead to an improved understanding of the relative importance in these regions of photosynthesis in tropical plants, which removes carbon dioxide from the atmosphere, and biomass burning, which releases carbon dioxide to the atmosphere.
The early OCO-2 data hint at some potential surprises to come. “The agreement between OCO-2 and models based on existing carbon dioxide data is remarkably good, but there are some interesting differences,” said Christopher O’Dell, an assistant professor at CSU and member of OCO-2’s science team. “Some of the differences may be due to systematic errors in our measurements, and we are currently in the process of nailing these down. But some of the differences are likely due to gaps in our current knowledge of carbon sources in certain regions — gaps that OCO-2 will help fill in.”
Carbon dioxide in the atmosphere has no distinguishing features to show what its source was. Elevated carbon dioxide over a region could have a natural cause — for example, a drought that reduces plant growth — or a human cause. At today’s briefing, JPL scientist Christian Frankenberg introduced a map using a new type of data analysis from OCO-2 that can help scientists distinguish the gas’s natural sources.
Through photosynthesis, plants remove carbon dioxide from the air and use sunlight to synthesize the carbon into food. Plants end up re-emitting about one percent of the sunlight at longer wavelengths. Using one of OCO-2’s three spectrometer instruments, scientists can measure the re-emitted light, known as solar-induced chlorophyll fluorescence (SIF). This measurement complements OCO-2’s carbon dioxide data with information on when and where plants are drawing carbon from the atmosphere.
“Where OCO-2 really excels is the sheer amount of data being collected within a day, about one million measurements across a narrow swath,” Frankenberg said. “For fluorescence, this enables us, for the first time, to look at features on the five- to 10-kilometer scale on a daily basis.” SIF can be measured even through moderately thick clouds, so it will be especially useful in understanding regions like the Amazon where cloud cover thwarts most spaceborne observations.
The changes in atmospheric carbon dioxide that OCO-2 seeks to measure are so small that the mission must take unusual precautions to ensure the instrument is free of errors. For that reason, the spacecraft was designed so that it can make an extra maneuver. In addition to gathering a straight line of data like a lawnmower swath, the instrument can point at a single target on the ground for a total of seven minutes as it passes overhead. That requires the spacecraft to turn sideways and make a half cartwheel to keep the target in its sights.
The targets OCO-2 uses are stations in the Total Carbon Column Observing Network (TCCON), a collaborative effort of multiple international institutions. TCCON has been collecting carbon dioxide data for about five years, and its measurements are fully calibrated and extremely accurate. At the same time that OCO-2 targets a TCCON site, a ground-based instrument at the site makes the same measurement. The extent to which the two measurements agree indicates how well calibrated the OCO-2 sensors are.
Additional maps released today showed the results of these targeting maneuvers over two TCCON sites in California and one in Australia. “Early results are very promising,” said Paul Wennberg, a professor at Caltech and head of the TCCON network. “Over the next few months, the team will refine the OCO-2 data, and we anticipate that these comparisons will continue to improve.”
To learn more about OCO-2, visit:
Caltech manages JPL for NASA.
NASA monitors Earth’s vital signs from land, air and space with a fleet of satellites and ambitious airborne and ground-based observation campaigns. NASA develops new ways to observe and study Earth’s interconnected natural systems with long-term data records and computer analysis tools to better see how our planet is changing. The agency shares this unique knowledge with the global community and works with institutions in the United States and around the world that contribute to understanding and protecting our home planet.
For more information about NASA’s Earth science activities this year, see:
Alan Buis
Jet Propulsion Laboratory, Pasadena, Calif.
818-354-0474
[email protected]
Written by Carol Rasmussen
NASA Earth Science News Team
2014-435
延伸閱讀:
本網誌「氣候變遷」專欄各文