 Credit: NASA’s Scientific Visualization Studio
美國冰雪數據中心在2015年3月19日發布新聞,從往年的數據來看,冬季海冰最大覆蓋面積通常出現在 3 月12日,但2015年卻比往年提早了15天,在 2 月 25 日當天達到這次冬季覆蓋面積最大值1450 萬平方公里,比之前最低紀錄、2011 年的數值減少 12.9 萬平方公里,創下自 1979 年衛星監控以來冬季海冰覆蓋面積最大值的最低紀錄。
與1981到2010年的平均值相比,海冰面積減少了110萬平方公里。而一項新的研究發現,北極海冰在1975年到2012年間減少了65%。
北極跟地球上許多人有著極其遙遠的實際距離跟心理距離,台灣人幾乎不管北極發生了什麼事,也不知道北極發生的事情會跟台灣有何關連,所以如常度日,誰會管北極海冰多了多少、少了多少。就像只要一天有水用,哪管什麼節約用水跟限水危機,那是別人的事,不是自己的事。我們的環境教育沒有因為環境教育法的實施而更為擴及,卻顯得更為公式化、市場化(不見得不好,但就有掛羊頭賣狗肉的事)、遊戲化與交差化。台灣人(尤其政務官與民意代表)的環境覺知與環境素養還有很大的加強空間。唉,扯遠了。
 圖中白色是北極區2015年2月25日有冰的範圍,橘線是1981年到2010年冰域中位數(中間值)的範圍,可以看出海冰退縮的情形。圖中有一個+符號,是北極點。 Credit:National Snow and Ice Data Center
底下由美國太空總署將2015年(2月25日)北極最大冰域是歷年最小冰域的資料轉為視覺化影片,最後可以看到,部分結冰地區甚至退縮達558公里的距離,這是可怕的警訊。
Credit: NASA’s Scientific Visualization Studio
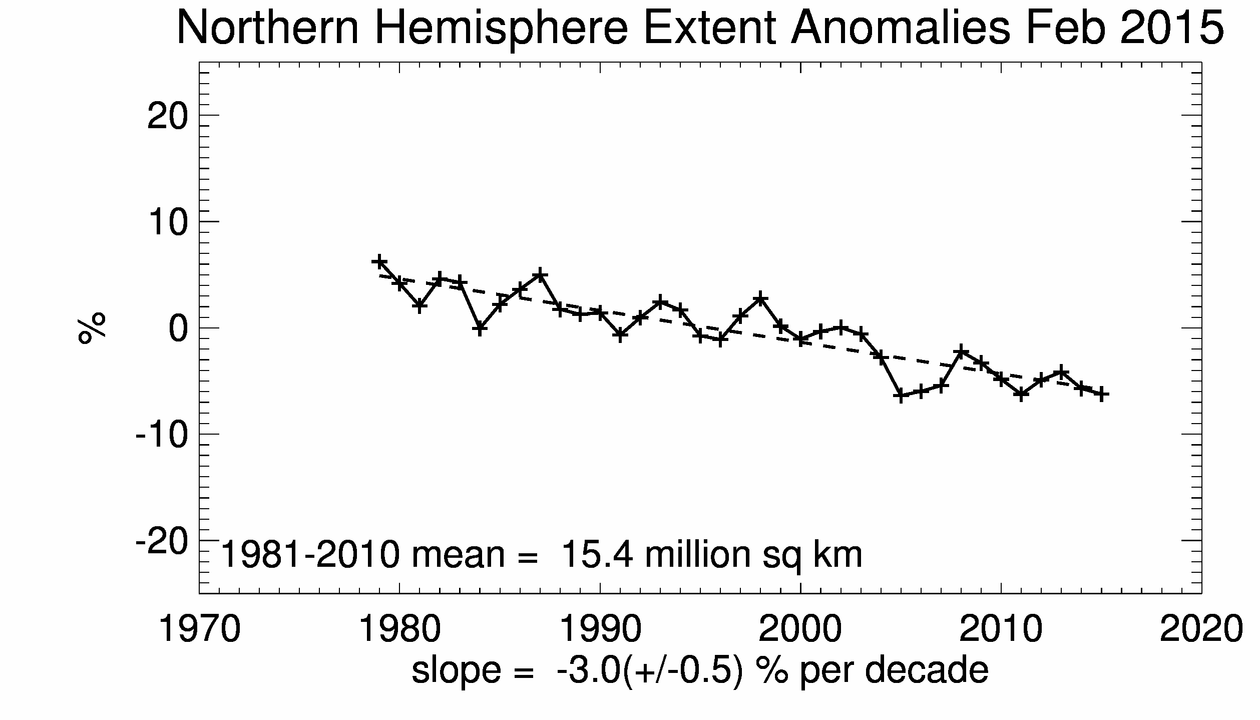 從這張圖也可以明顯看出,北極冰域範圍是朝縮減(每年斜率-3.0)的趨勢前進,人們卻毫不緊張。Credit: National Snow and Ice Data Center
下表是我整理美國國家冰雪數據中心的資料,顯示1979-2014年各年9月(夏季)北極冰域面積數字,可以從數字直接看出2012年是從1979年有衛星探測紀錄以來冰域面積最小的一次,2013與2014則有快速回升情形。此表也可看出1980年代是很穩定的,都有700萬平方公里;1990年代開始有劇烈變化,在100萬平方公里間上下震盪;到了21世紀開始有明顯縮減趨勢,從600多萬平方公里一路縮到近幾年的400多萬平方公里。
|
年度 |
面積(百萬平方公里) |
|
2014 |
5.0 |
|
2013 |
5.1 |
|
2012 |
3.4 |
|
2011 |
4.6 |
|
2010 |
4.9 |
|
2009 |
5.4 |
|
2008 |
4.7 |
|
2007 |
4.3 |
|
2006 |
5.9 |
|
2005 |
5.6 |
|
2004 |
6.0 |
|
2003 |
6.1 |
|
2002 |
6.0 |
|
2001 |
6.8 |
|
2000 |
6.3 |
|
1999 |
6.2 |
|
1998 |
6.6 |
|
1997 |
6.7 |
|
1996 |
7.9 |
|
1995 |
6.1 |
|
1994 |
7.2 |
|
1993 |
6.5 |
|
1992 |
7.5 |
|
1991 |
6.6 |
|
1990 |
6.2 |
|
1989 |
7.0 |
|
1988 |
7.5 |
|
1987 |
7.5 |
|
1986 |
7.5 |
|
1985 |
6.9 |
|
1984 |
7.2 |
|
1983 |
7.5 |
|
1982 |
7.5 |
|
1981 |
7.3 |
|
1980 |
7.8 |
|
1979 |
7.2 |
以下為美國冰雪數據中心新聞稿原文:
Arctic sea ice reaches lowest maximum extent on record
On February 25, 2015, Arctic sea ice extent appeared to have reached its annual maximum extent, marking the beginning of the sea ice melt season. This year’s maximum extent not only occurred early; it is also the lowest in the satellite record. However, a late season surge in ice growth is still possible. NSIDC will post a detailed analysis of the 2014 to 2015 winter sea ice conditions in early April.
Overview of conditions
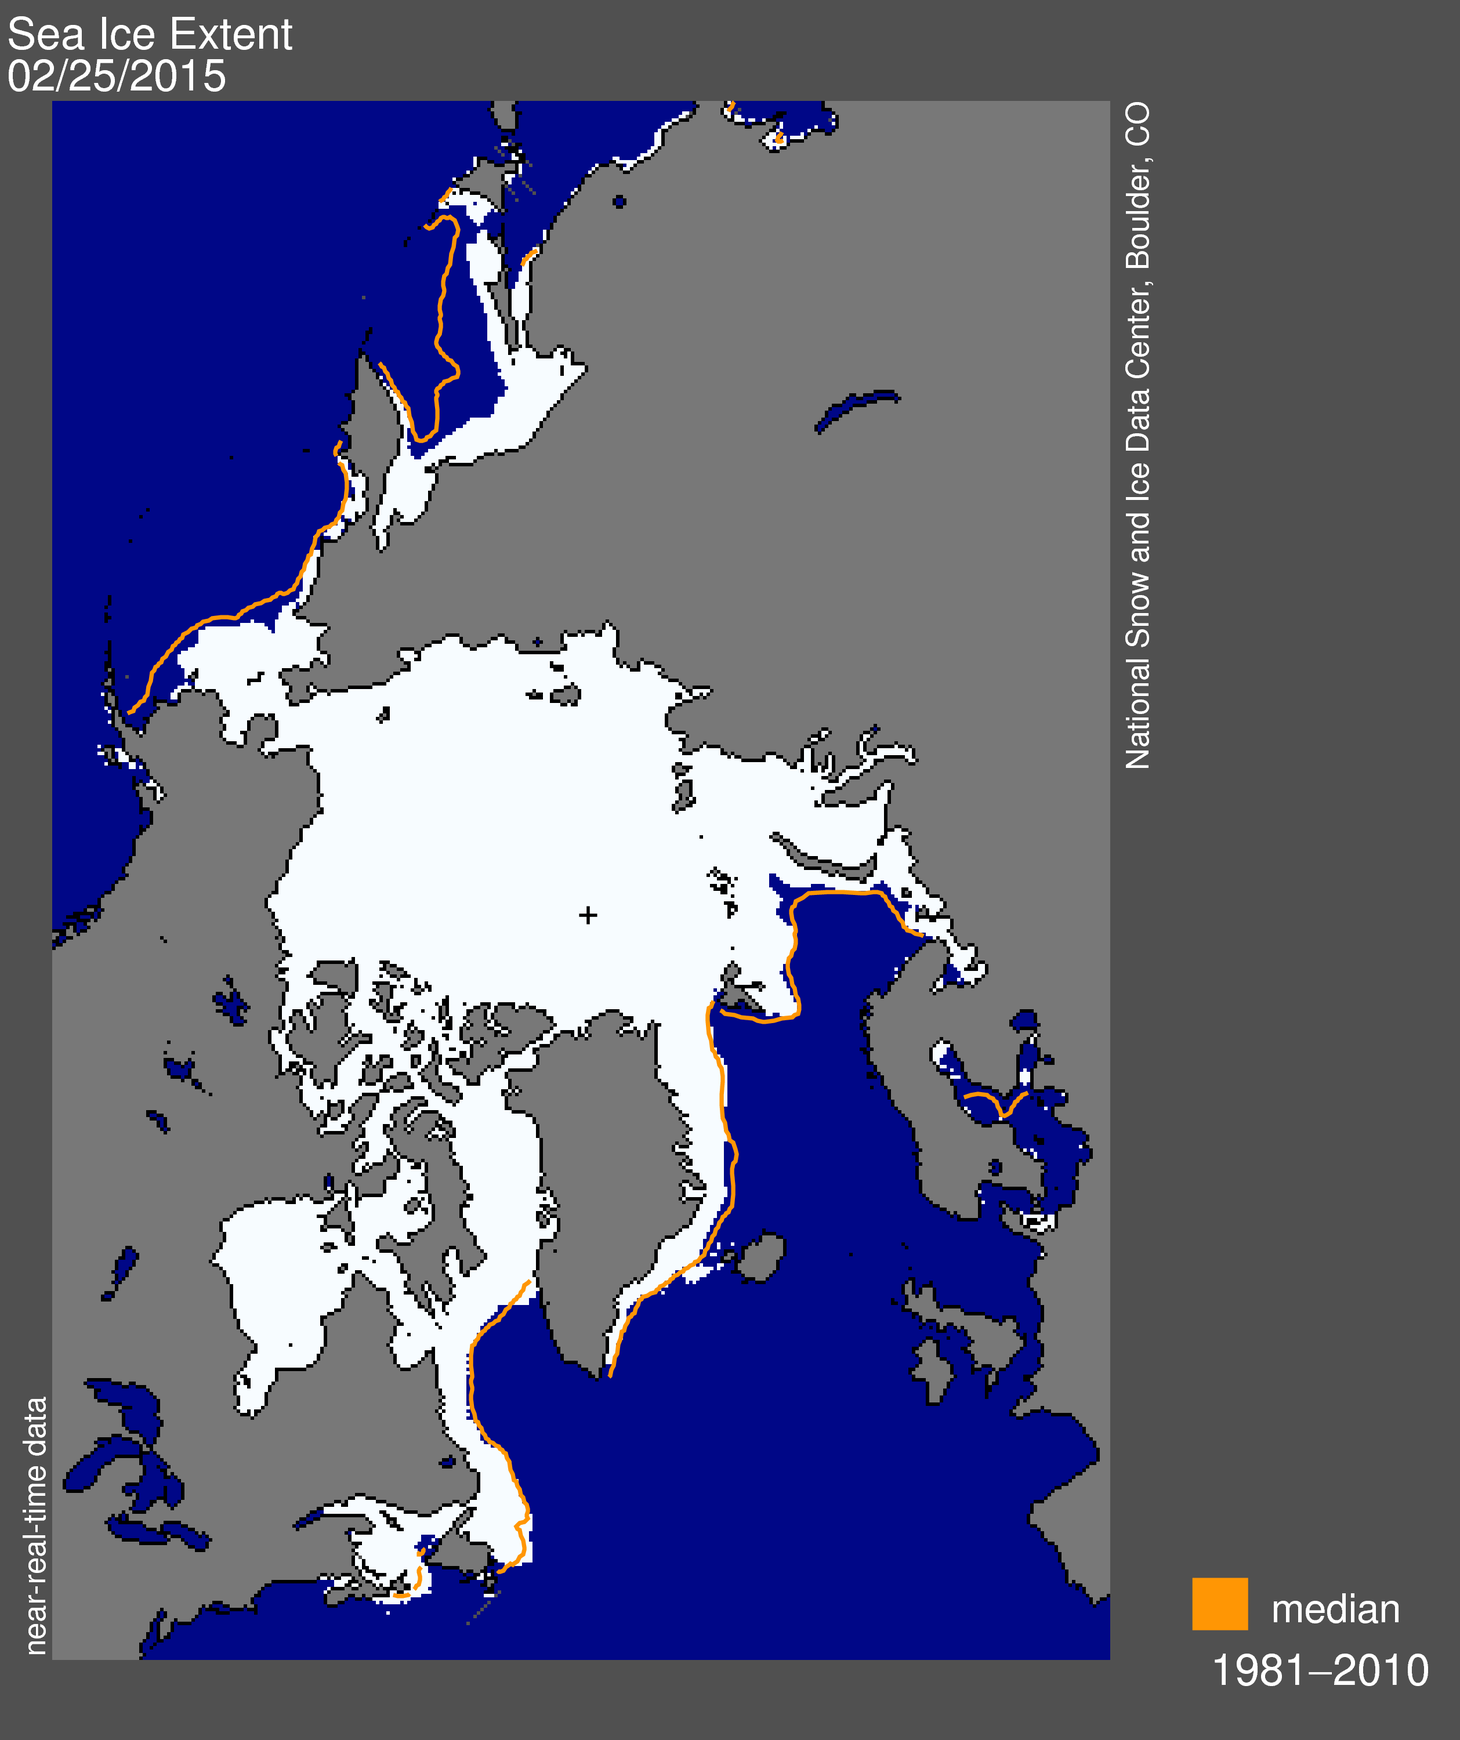
Figure 1. Arctic sea ice extent for February 25, 2015 was 14.54 million square kilometers (5.61 million square miles). The orange line shows the 1981 to 2010 median extent for that day. The black cross indicates the geographic North Pole. Sea Ice Index data.About the data
Credit: National Snow and Ice Data Center
High-resolution image
On February 25, 2015 Arctic sea ice likely reached its maximum extent for the year, at 14.54 million square kilometers (5.61 million square miles). This year’s maximum ice extent was the lowest in the satellite record, with below-average ice conditions everywhere except in the Labrador Sea and Davis Strait. The maximum extent is 1.10 million square kilometers (425,000 square miles) below the 1981 to 2010 average of 15.64 million square kilometers (6.04 million square miles) and 130,000 square kilometers (50,200 square miles) below the previous lowest maximum that occurred in 2011. This year’s maximum occurred 15 days earlier than the 1981 to 2010 average date of March 12. The date of the maximum has varied considerably over the years, occurring as early as February 24 in 1996 and as late as April 2 in 2010.
Because of the variability of ice extent at this time of year, there can be some delay in pinpointing the date of the maximum extent, as was true this year. NSIDC calculates daily ice extent as an average of the previous five days (see the Sea Ice Index documentation for more information), and we also look for a clear downward trend for a number of days.
While the downturn in extent was quite pronounced on February 25, the trend subsequently flattened. This is in part due to recent ice growth in the Bering Sea, partly balancing continued ice retreat in the Barents and Kara seas. Over the next two to three weeks, periods of increase are still possible. However, it now appears unlikely that there could be sufficient growth to surpass the extent reached on February 25.
Conditions in context
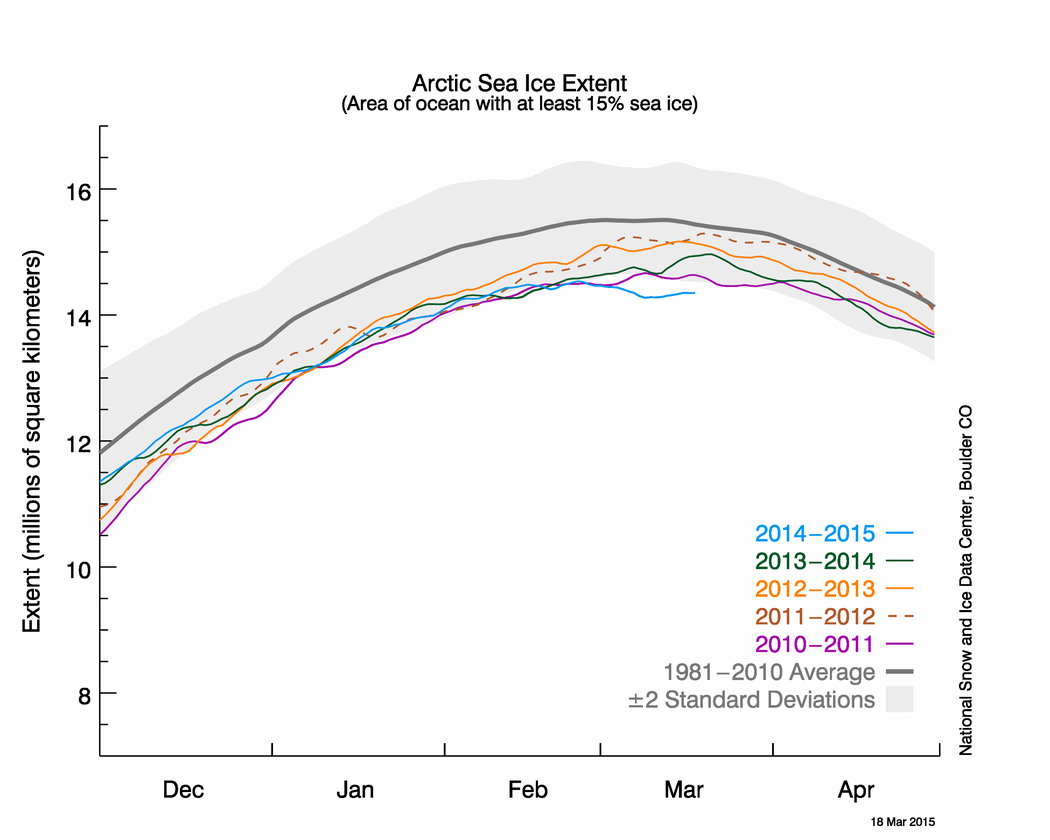
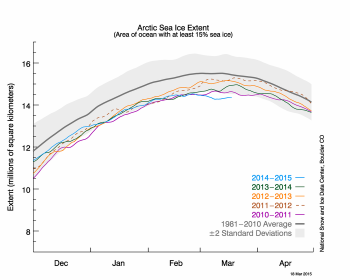
Figure 2. The graph above shows Arctic sea ice extent as of March 18, 2015, along with daily ice extent data for four previous years. 2014 to 2015 is shown in blue, 2013 to 2014 in green, 2012 to 2013 in orange, 2011 to 2012 in brown, and 2010 to 2011 in purple. The 1981 to 2010 average is in dark gray. The gray area around the average line shows the two standard deviation range of the data.Sea Ice Index data.
Credit: National Snow and Ice Data Center
High-resolution image
Over the 2014 to 2015 winter season, sea ice extent grew 9.91 million square kilometers (3.83 million square miles). This was substantially less ice growth than last year, which saw record growth over the winter. Part of the explanation for the record low maximum lies with recent weather patterns. As discussed in our previous post, February was characterized by an unusual configuration of the jet stream, leading to warm conditions over the Pacific side of the Arctic that maintained low sea ice extent in the Bering Sea and the Sea of Okhotsk. Furthermore, since the last half of February through the middle of March, the Arctic Oscillation was in a strongly positive phase, with index values exceeding 5.0 for several days in the first week of March. This has been expressed as a strong Icelandic Low, a semi-permanent area of low atmospheric pressure found between Iceland and southern Greenland and extending into the Barents Sea. The strong Icelandic Low led to a pattern of surface winds over the Barents and Kara seas with an unusually strong component from the south.
Over the first two weeks of March, temperatures throughout the eastern Arctic at the 925 hPa level (approximately 3,000 feet altitude) were several degrees Celsius above average, with temperatures as much as 8 to 10 degrees Celsius (14 to 18 degrees Fahrenheit) above average in the Barents Sea between Svalbard and Franz Josef Land.
While the seven-day weather forecasts show continued warmer-than-average conditions over the eastern Arctic, colder-than-average conditions are expected over the Bering Sea and may still lead to some new ice formation. Thus, while the maximum appears to have occurred on February 25, late season ice growth may still occur.
Final analysis pending
At the beginning of April, NSIDC scientists will release a full analysis of winter conditions, along with monthly data for March. For more information about the maximum extent and what it means, see the NSIDC Icelights post, the Arctic sea ice maximum.
Updates to the Sea Ice Index
Recently, NSIDC made two revisions to Arctic Sea Ice Index extent values used in our analyses, to improve scientific accuracy. These changes do not significantly affect sea ice trends and year-to-year comparisons, but in some instances users may notice very small changes in values from the previous version of the data. First, calculations of ice extent near the North Pole were improved whenever a newer satellite orbited closer to the pole than older satellites in the series, by using a sensor-specific pole hole for the extent calculations. Second, the accuracy of ice detection near the ice edge was slightly improved by adopting an improved residual weather effect filter. Details on the changes are discussed in the Sea Ice Index documentation.
延伸閱讀:
本網誌「氣候變遷」 專欄各文