美國太空總署及美國國家海洋暨大氣總署於2019年2月6日宣布,2018年地球溫度相較1951年-1980年的均溫高出攝氏0.83度。排在2016、2017、2015史上最熱前三名之後,成為史上第四熱的一年。(註:有的研究將2015與2017的排行對調)
Earth’s global surface temperatures in 2018 were the fourth warmest since 1880, according to independent analyses by NASA and the National Oceanic and Atmospheric Administration (NOAA).
Global temperatures in 2018 were 1.5 degrees Fahrenheit (0.83 degrees Celsius) warmer than
這是持續長期氣候變遷的明顯跡象。從1880年代至今,地球均溫已平均上升約攝氏1度,這與人類排放大量的二氧化碳及其他溫室氣體到大氣有極大關連。
2018 is yet again an extremely warm year on top of a long-term global warming trend. Since the 1880s, the average global surface temperature has risen about 2 degrees Fahrenheit (1 degree Celsius). This warming has been driven in large part by increased emissions into the atmosphere of carbon dioxide and other greenhouse gases caused by human activities
美國國家海洋暨大氣總署分析指出,2018年地球均溫相較20世紀均溫高出攝氏0.79度。
NOAA’s analysis found 2018 global temperatures were 1.42 degrees Fahrenheit (0.79 degrees Celsius) above the 20th-century average.
英國氣象局甚至預測2019年有可能破升溫紀錄。
2019: close to
CNN報導說:地球19個最熱年度,有18個是在2001年之後的。
Eighteen of the hottest 19 years have occurred since 2001
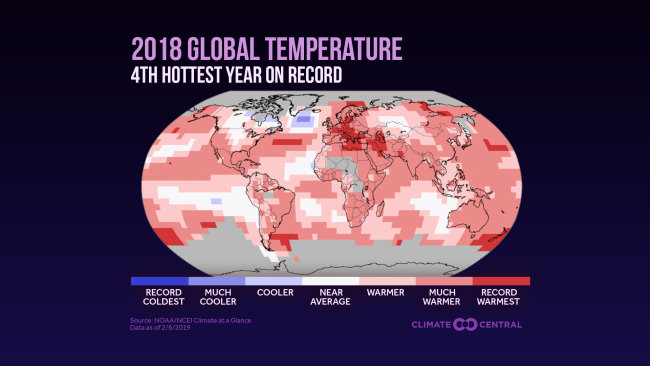 2018年是史上第四熱年 Credit: Climate Central
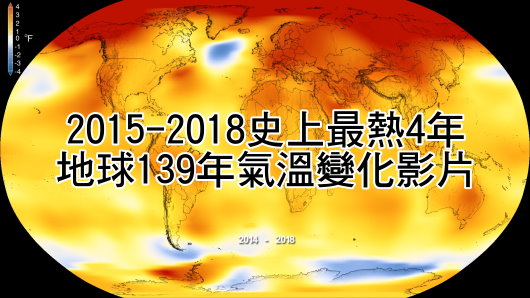
底下影片是NASA以1951年至1980年的地球均溫為基準,每五年為一個比較期,呈現1880年至2018年139年來地球逐漸發燒的情形。(藍色表示低於均溫,黃色至紅色表示高於均溫,且愈紅愈高。)
Credit: NASA’s Goddard Space Flight Center/Kathryn Mersmann 影片可下載
影片中英文字幕翻譯如下:
地球數十年來不斷增溫 Earth has been warming up for decades.
過去五年是史上最熱的五年 The last five years are the hottest five years on record
而且過去四年都超過均溫攝氏1度 And the last four were all more than 1 degree Celsius
高於19世紀均溫 warmer than the 19th Century average.
氣候暖化將造成 A warmer climate contributes to…
美國太空總署及美國國家海洋暨大氣總署合作從各測候站研究地球溫度變化 NASA and NOAA work together to study the temperature from weather stations,
資料來自海上的船舶與浮筒,以及南極各研究站 ships, and buoys in the ocean, and Antarctic research stations.
下圖分別是美國太空總署(紅線)、及柏克萊地球研究機構(黑線)、日本氣象廳(紫線)、美國國家海洋暨大氣總署(綠線)、英國氣象局(藍線)以1951年至1980年的地球均溫為基準,呈現1880年至2018年139年來地球氣溫變化的曲線,大同小異,從1970年代末期開始就都高於長期均溫,並且呈現一路增溫的趨勢。
底下是截至2018年底,地球最熱十年的排行:
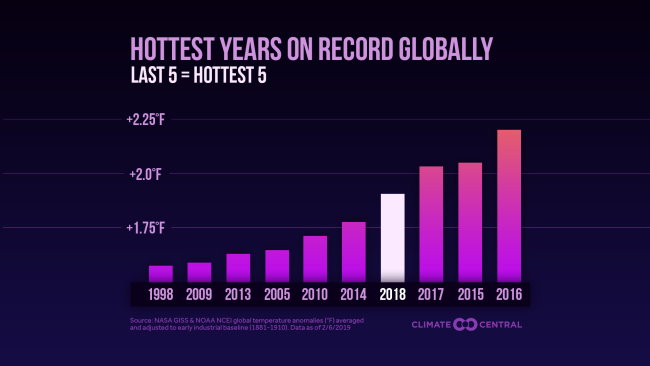 Credit: Climate Central
人類再不及時積極做好節能減排工作,必將很快面對更多更強極度嚴苛天候的摧殘!人類滅忙倒不要緊,可憐是地球上其他生命要跟著遭殃,那真是人類最大罪過!
延伸閱讀:
北極冰況消融危機持續惡化-2018北極報告摘要(影片、相片、數據)-中英對照
北極急速解凍 氣候問題嚴重—2017年地球發燒與北極冰況總檢視(數據、圖片、影片)-中英對照
NASA:2017年是史上第二熱 50秒看地球138年逐漸發燒狀況(影片)
北極冰融得更快了—2016年地球發燒與北極冰況總檢視(數據、圖片、影片)
2016年史上最熱,48秒影片看地球137年逐漸發燒狀況(含2016年全球氣候報告)
本網誌「氣候變遷」專欄各文


身為關注環境生態的一員,我們不能忽視這問題的嚴重性!