2016年是所有國際氣候研究機構公認有氣象紀錄以來最熱的一年,但對2017年看法就不同,美國航空暨太空總署(NASA)說2017年是史上第二熱年,美國國家海洋暨大氣總署(NOAA)與英國氣象局(Met Office)則認為是史上第三熱,差異是在依據的科學資料不同,但無論是第二熱或是第三熱,2017年就是熱。尤其有一點要注意,2017年不是聖嬰年,而2017年是地球非聖嬰年的最高溫年。
Earth’s surface temperatures in 2017 were the second warmest since since 1880, when global estimates first become feasible, NASA scientists found.
Global temperatures in 2017 were second only to 2016, which still holds the record for the hottest year. However, 2017 was the warmest year without an El Niño.
In a separate, independent analysis, NOAA scientists found that 2017 was the third-warmest year in their record. The minor difference is due to different methods to analyze global temperatures used by the two agencies, although over the long-term the records remain in strong agreement.
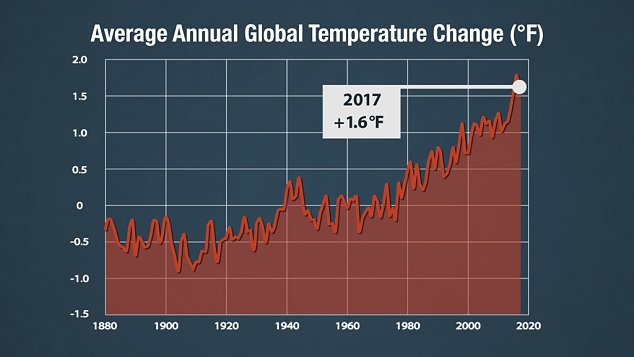 根據NASA統計資料,以1951年至1980年的地球均溫為基準,2017年高出約攝氏0.9度(華氏1.62度),是次於2016年的第二高溫。
Continuing the planet’s long-term warming trend, globally averaged temperatures in 2017 were 1.62 degrees Fahrenheit (0.90 degrees Celsius) warmer than the 1951 to 1980 mean, according to scientists at NASA’s Goddard Institute for Space Studies (GISS) in New York. That is second only to global temperatures in 2016.
因為人類大量排放二氧化碳及其他溫室氣體,上世紀地表均溫已經上升約攝氏1度多一點(華氏2度),而2017年也是連續第三年高於19世紀後期均溫平均值攝氏1度(華氏1.8度)以上。
The planet’s average surface temperature has risen about 2 degrees Fahrenheit (a little more than 1 degree Celsius) during the last century or so, a change driven largely by increased carbon dioxide and other human-made emissions into the atmosphere. Last year was the third consecutive year in which global temperatures were more than 1.8 degrees Fahrenheit (1 degree Celsius) above late nineteenth-century levels.
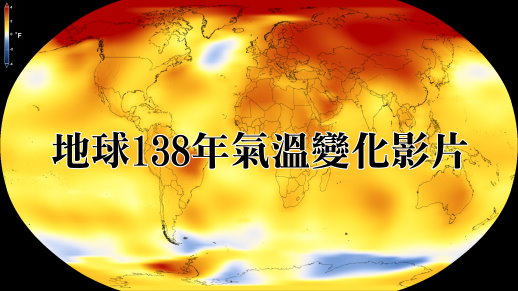
底下影片是NASA以以1951年至1980年的地球均溫為基準,每五年為一個比較期,所呈現138年來地球逐漸發燒的情形。(藍色表示低於均溫,黃色至紅色表示高於均溫,且愈紅愈高。)
Credits: NASA’s Scientific Visualization Studio/K. Mersmann 影片可下載
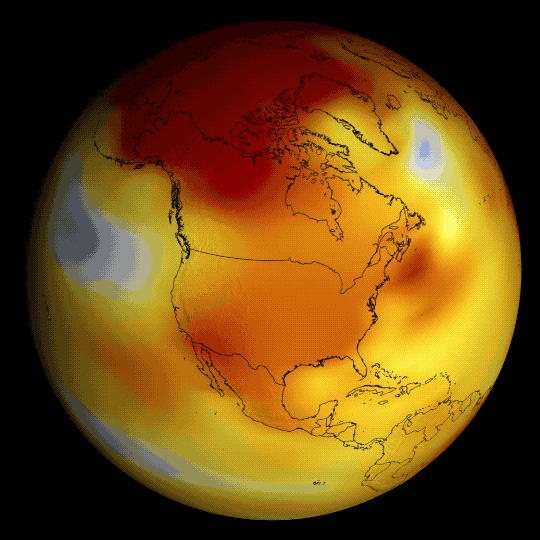 2017年地球發燒區域(Gif of 2017 Temperature Data Wrapped to a Globe) Credits: NASA’s Scientific Visualization Studio/K. Mersmann
2017年地表溫度視覺化資料(2017 Global Temperature Visuals)可在https://svs.gsfc.nasa.gov/cgi-bin/details.cgi?aid=12828&button=recent取得並下載運用。
英國氣象局(Met Office)製作一部影片,顯示從1850年開始到2017年止,以色塊顯示當年溫度與地球均溫比較之高或低狀況,顏色愈暗表示溫差愈低,顏色愈淡表示溫差愈高,就是地球更熱的意思。(Visualisation showing temperatures between 1850 and 2017. The lighter the colour the higher the global average temperature.)
人類再不積極節能減排,地球愈來愈高溫,引發的氣候變化、糧食減產、疫病蔓延、水源匱乏……等問題將會愈來愈嚴重,而且不會是現在人們可以想像的嚴重!
下表由英國氣象局統計,顯示從2000年至2017年地表均溫跟1850至1900長期及1981至2010均溫比較之溫差
The table below (based upon HadCRUT4) provides the temperature (anomaly) for each year between 2000 and 2017, relative to two long-term averages (of 1850-1900 and 1981 to 2010). Credit: Met Office
| Year
年度 |
Anomaly
溫差 |
Uncertainty (±) | Anomaly
溫差 |
Uncertainty (±) |
| (°C relative to 1850–1900)
相較1850-1900地表均溫攝氏度 |
(95% confidence range °C)
95%信心區間 |
(°C relative to 1981-2010)
相較1981-2010地表均溫攝氏度 |
(95% confidence range °C)
95%信心區間 |
|
| 2017 | 0.99 | 0.1 | 0.38 | 0.1 |
| 2016 | 1.11 | 0.1 | 0.50 | 0.1 |
| 2015 | 1.08 | 0.1 | 0.47 | 0.1 |
| 2014 | 0.89 | 0.1 | 0.29 | 0.1 |
| 2013 | 0.83 | 0.1 | 0.22 | 0.1 |
| 2012 | 0.79 | 0.1 | 0.18 | 0.1 |
| 2011 | 0.74 | 0.1 | 0.13 | 0.1 |
| 2010 | 0.87 | 0.1 | 0.27 | 0.1 |
| 2009 | 0.82 | 0.1 | 0.21 | 0.1 |
| 2008 | 0.71 | 0.1 | 0.10 | 0.1 |
| 2007 | 0.81 | 0.1 | 0.20 | 0.1 |
| 2006 | 0.82 | 0.1 | 0.21 | 0.1 |
| 2005 | 0.86 | 0.1 | 0.25 | 0.1 |
| 2004 | 0.76 | 0.1 | 0.15 | 0.1 |
| 2003 | 0.82 | 0.1 | 0.21 | 0.1 |
| 2002 | 0.81 | 0.1 | 0.20 | 0.1 |
| 2001 | 0.75 | 0.1 | 0.15 | 0.1 |
| 2000 | 0.61 | 0.1 | 0.00 | 0.1 |
| 1999 | 0.62 | 0.1 | 0.01 | 0.1 |
| 1998 | 0.85 | 0.1 | 0.25 | 0.1 |
延伸閱讀:
北極急速解凍 氣候問題嚴重—2017年地球發燒與北極冰況總檢視(數據、圖片、影片)-中英對照
2016年史上最熱,48秒影片看地球137年逐漸發燒狀況(含2016年全球氣候報告)
北極冰融得更快了—2016年地球發燒與北極冰況總檢視(數據、圖片、影片)
本網誌「氣候變遷」專欄各文
聯合報:人為暖化明顯 2017「無聖嬰的最暖年」(2018/01/19)
NASA新聞:Long-Term Warming Trend Continued in 2017: NASA, NOAA(2018/01/18)


燃燒的地球
光憑想像與憂心,已無法扭轉終局吧!
如何愛下一代?
請用50秒時間關心地球138年來暖化的嚴重情況,人類還要彼此爭奪內鬥相殘嗎? 在大自然前面無一倖免!