台灣地區近年來空污霾害愈來愈嚴重,各方爭論空氣污染來源,可悲的是政府高層卻把問題推給對岸,說大部分空污來自境外,還睜眼說瞎話防治空污有進步,意思是台灣自己製造的污染還不嚴重,還可以打混下去。然台灣人現在關注焦點放在PM2.5的問題上,對世界整個氣候變化的議題卻不一定關切。台灣現在正力求實現非核家園,這本是很好的願景,但急促操作下卻換來火力(燃煤與天然氣)發電的排碳量大增,除了加重空污問題外,也對地球暖化起了很不好的「貢獻」。而地球暖化讓遠在天邊的北極環境早已開始驚天動地的改變,台灣雖然還離得遠,感受不直接,但這就像冷水煮青蛙,等到知覺水燙得不得了時(如海平面上升、異常極端氣候頻仍、自然災害嚴重、糧食減產、疫病叢生、資源匱乏……),為時晚矣,於是再添一樁「歷史共業」。
影片中,一隻骨瘦如柴的北極熊到生鏽垃圾桶翻找食物的畫面令人鼻酸。北極熊是全球暖化的指標物種,重達半噸的北極熊靠捕食海冰上的海豹維生。在夏季時,北極熊因為融冰的關係,可能好幾個月都沒有進食,為的就是等北極圈的海水結冰,然後開始捕食海冰上的海豹。不過,全球暖化讓北極圈的溫度上升,海水除了不易結冰外,就算結了冰也會提早融化,讓把海冰當獵場和棲地的北極熊無所適從,只好餓著肚子在陸地上覓食,繁殖季的表現也不盡理想。北極熊現在的慘狀,也將是人類生活的寫照。
美國「國家海洋暨大氣總署」(National Oceanic and Atmospheric Administration,NOAA)在2017年12月12日發布《2017年北極報告》(Arctic Report Card)指出,北極正經歷「人類歷史上前所未見的變遷」,加速海平面上升、提高極端氣候現象的發生頻率。報告指出,沒有跡象顯示,北極能夠回到幾十年前的穩定凍結區域狀態(Arctic shows no sign of returning to reliably frozen region of recent past decades)。
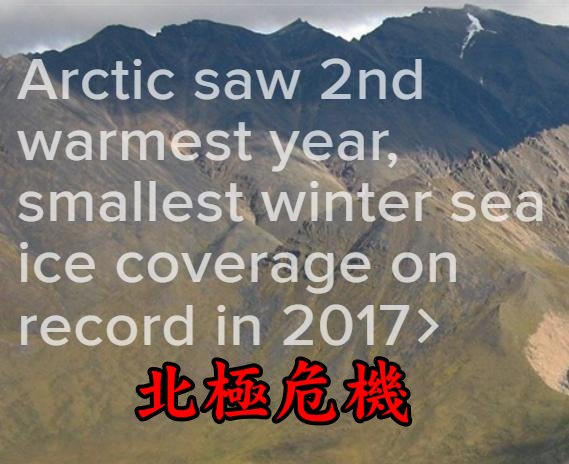
這份來自 12 國、85 名科學家彙編的同儕審查報告指出,北極2017年冬季海冰縮減至有紀錄以來最小、氣溫達近代第 2 高溫(Arctic saw 2nd warmest year, smallest winter sea ice coverage on record in 2017)。
報告指出:「至少過去 1,500 年來、甚至可能更久,21 世紀海冰與海洋表面暖化的趨勢是前所未見。」這份報告還說:「許多有力指標持續顯示,北極環境體系已經到達『新常態』。(編按:意指北極暖化、海冰減少是新常態,這不是很可悲、可怕的事嗎?)
Credit: https://www.arctic.noaa.gov/Report-Card/Report-Card-2017
我整理該報告及其他氣候調查研究機構一些資料給大家參考,了解北極已經面臨棘手危機,人類(台灣人當然不能置身事外)再不積極採取改善行動,改變生活行為,停止大量排碳,終將自食惡果。(翻譯如有錯誤,敬請不吝指正。)
以下幾張圖表,可以看出2017北極的暖化狀況已經極度嚴重:
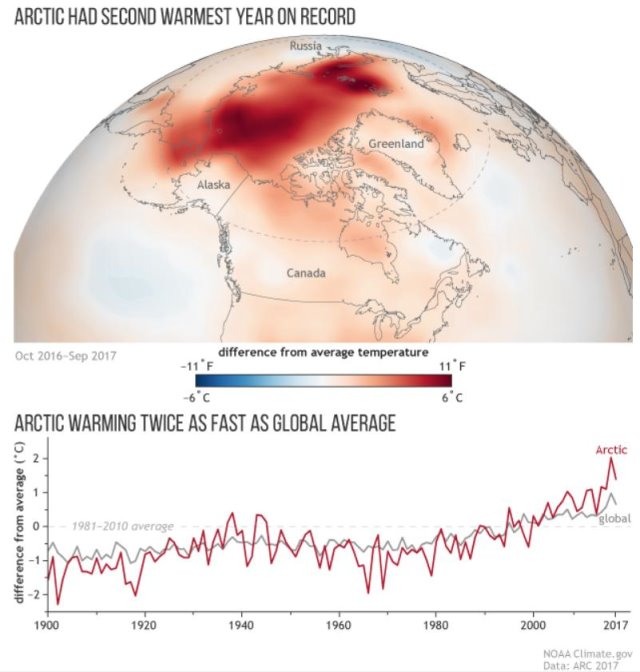
(2017 Arctic Report Card: Extreme fall warmth drove near-record annual temperatures)
Image Credit: NOAA Climate.gov based on data from ARC 2017
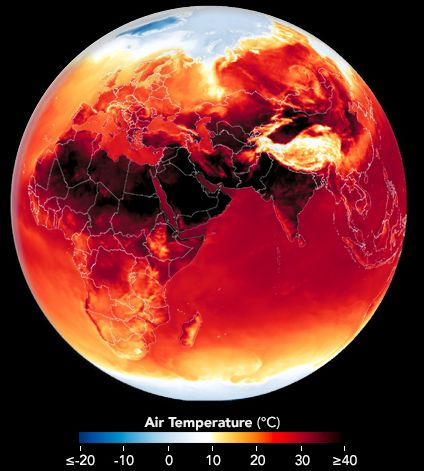
圖上半部顯示北極溫度從2016年10月至2017年9月期間與1981-201年平均值之比較,顏色愈深紅表示比平均溫度愈高。有一條不甚明顯的虛線圓圈,那是北緯60度,表示北極圈範圍。
This map shows temperature from October 2016-September 2017 compared to the 1981-2010 average. (The climate-monitoring year in the Arctic traditionally ends in September, when sea ice reaches
圖下半部紅線是北極陸地每年均溫,灰線是全球1981-2010均溫。紅線2017年看起來比2016年低,表示2017年北極陸地2017年有比2016年涼快些,但若與全球均溫比起來,還是高了約攝氏1.5度。從紅線與灰線斜率比較,北極增溫速度是全球二倍。
Below the map is a graph that compares the history of surface temperatures at land stations in the Arctic (red line) to the whole globe (gray line). Each year temperature is compared to the 1981-2010 average (dashed line at zero). The past year was slightly cooler than 2016, but it was still nearly 1.5 degrees Celsius warmer than the 1981-2010 average. The rate of warming in the Arctic is twice the rate occurring over the globe as a whole.
(2017 Arctic Report Card: Warm summers challenge Bering Sea pollock)
生活在北極地區的白令海鱈魚是冷水性魚類,如果海水溫度上升,海冰覆蓋範圍縮小,牠所賴以棲息的海冰下冷水範圍也跟著縮小,不利於牠的生存,這問題在愈來愈高溫的夏天就顯得危機重重。 左邊圖顯示的是2012年夏天海冰覆蓋範圍下的白令海鱈魚棲地範圍(不同深淺藍色的區域),但到了2016年夏天(右邊圖),海冰範圍急速退縮,白令海鱈魚棲地也限縮在很小的範圍。
This pair of images illustrates the relationship between two environmental variables that strongly influence young pollock survival rates: the extent of late winter sea ice across the Eastern Bering Sea and the size of a pool of cold bottom water that develops below it. Young pollock have higher energy reserves going into winter in years when the cold pool is large and persists into summer.
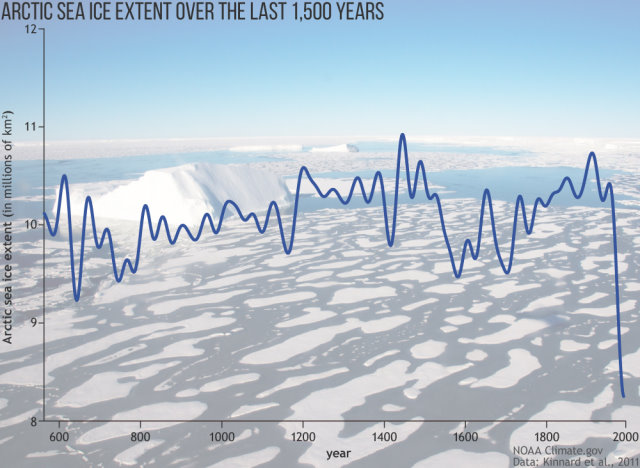
(2017 Arctic Report Card: Sea ice melting unprecedented in at least 1,500 years)
圖示在過去1500年間,北極海冰覆蓋範圍有數百萬(甚至千萬)平方公里之廣,也可看到在前1450年間海冰區域本就會隨著地球溫度上下而縮小或擴大,但都比不上近代縮小程度之劇烈,這表示人為因素(大量排碳增進全球暖化)是造成北極冰域急速縮減的主因。
This time series shows the Arctic sea ice extent in millions of square kilometers over the past roughly 1,500 years. Scientists use climate proxies like sediment/ice cores, tree rings, and fossilized shells of ocean creatures to extend the sea ice extent records back in time. These records show that while there have been several periods over the past 1,450 years when sea ice extents expanded and contracted, the decrease during the modern era is unrivaled. And just as importantly, it is beyond the range of natural variability, implying a human component to the drastic decrease observed in the records.
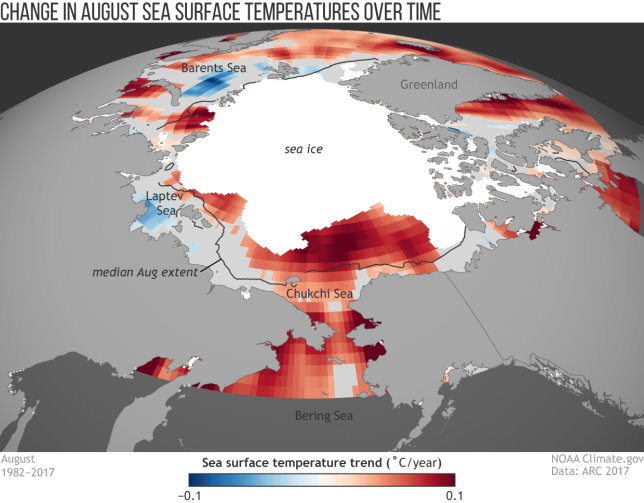
(2017 Arctic Report Card: Summer temperatures are rising rapidly in most Arctic seas)
上圖顯示1982-2017年8月(每年夏季最高溫時期)北極圈內溫度趨勢,愈深紅色表示溫度愈高,藍色表示氣溫較低,淺灰色表示在統計上沒有明顯變化趨勢。白色區域顯示2017年8月有結冰的範圍,很明顯比1982-2010年8月冰域中位數範圍(黑線)小太多了。
This map shows the trend in ocean temperatures for the entire Arctic in August—the height of summer warmth—from 1982-2017. Redder colors mean that ocean waters are warming, while bluer colors mean that they are cooling. Places where the observations revealed no statistically significant trend are colored light gray. The white area shows the August 2017 ice extent, which was significantly smaller than the 1982-2010 median extent (black line).
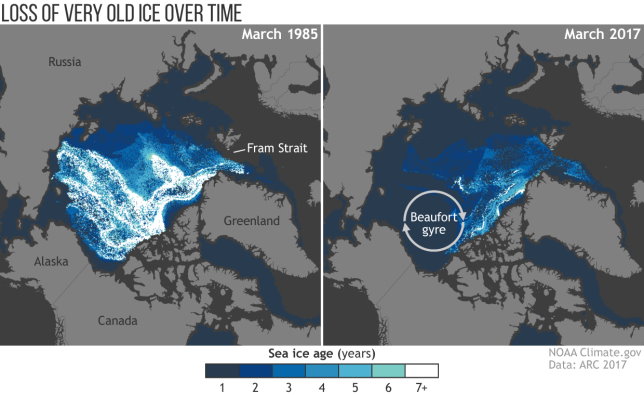
(2017 Arctic Report Card: Arctic sea ice keeps getting younger and thinner)
上圖顯示1985年(左)與2017年(右)3月冬季結束時,北極結冰區域冰齡變化情形。第一年冰是深藍色,大部份是前一個冬天生成的。經過9個冬天的冰則以白色表示。至於深灰色區域,則是開放水域或海岸地區。從上圖之比較,可以明顯看出北極地區的陳年冰急速融化,剩下的多為一年內的冰,在夏天就會完全變成海水,長期趨勢就會是北極都沒有冰了,只剩海水,當然也會導致全球海平面上升,淹沒現在很多人口居住的沿岸地帶。
These satellite-based maps show the age of the ice in the Arctic at the end of winter in March 1985 (left) and March 2017 (right). The first age class on the scale (1, darkest blue) means “first-year ice,” which formed in the most recent winter. The oldest ice (>7, white) is ice that is more than nine winters old. Dark gray areas indicate open water or coastal regions where the spatial resolution of the data is coarser than the land map.
接下來提供的是2017北極報告重點(highlights)的翻譯:
- 2016年10月至2017年9月一年間的北極海平面均溫高於1981-2010年均溫攝氏1.6度,是1900年有紀錄以來的第二高溫(2016年是第一高溫)。
- The second warmest (after 2016) surface air temperature anomaly (+1.6° C relative to 1981-2010) north of 60° N since the year 1900 was observed between October 2016 and September 2017.
- 2017年3月7日衛星觀測記錄到北極海冰呈現1979年至今在冬天結冰期的最小覆蓋範圍。與1979-2010年平均覆蓋面積比較,2017年3月(每年結冰最多時)減少8%、9月(每年結冰最少時)減少25%的覆蓋面積。而且北極海冰持續年輕化(結冰未滿一年)與薄層化,2017年多年冰(超過一年以上的冰)只有21%,在1985年時則有45%。
- On the 7th of March 2017 satellites observed the lowest winter maximum in sea ice on record (1979-present). The March maximum was 8% lower and the September minimum was 25% lower than the 1981-2010 average sea ice extent. The sea ice cover continues to be relatively young and thin with multiyear ice (more than
1 year old ) comprising only 21% of ice cover in 2017 compared to 45% in 1985.
- 阿拉斯加北方的楚科奇海海面溫度有增高趨向,從1982年起,每十年溫度增高約攝氏0.7度。甚至2017年8月巴倫支海與楚科奇海較1982-2010年間平均溫度高出攝氏4度。
- Sea surface temperature in the Chukchi Sea, northwest of Alaska, has experienced the largest warming trend: ~0.7° C per decade since 1982. In August 2017 the Barents and Chukchi seas experienced surface temperatures up to 4° C warmer than the 1982-2010 average.
- 2013-2017年巴倫支海與北極歐亞區的海洋初級生產力與長期數字比較有明顯增高趨勢。長期資料顯示,這幾年初級生產力提高與春夏季節交替時的海冰提早崩解有關。
- The most pronounced increasing trends in ocean primary productivity during the 2003-2017 period were observed in the Barents Sea and Eurasian Arctic regions. Long-term records reveal that years with elevated ocean productivity levels are often associated with earlier sea ice breakup during the spring/summer transition.
- 過去15年間,格陵蘭島冰原每年平均減損約 2640-2700億噸(Gt:10億噸)的冰量。2017年6-8月期間融化了32.9%島上面積的冰,而冰所覆蓋的範圍則是1996後同期之最小值。
- The downward trend in total ice mass of the Greenland ice sheet averaged over the last 15 years is estimated at 264-270
Gt /yr. The spatial extent of melt for the period June, July and August 2017 reached a maximum of 32.9%, marking the lowest maximum extent since 1996.
- 2017年5月歐亞大陸的春雪覆蓋面積是1967年衛星監測以來第二廣。5-6月北極歐亞區的雪是在2005與2004年後的第一次回增現象。
- Spring snow cover extent over Eurasia in May 2017 was the 2nd highest recorded by satellite observations dating back to 1967. May and June snow cover extent anomalies over the Eurasian Arctic mark the first positive anomalies observed since 2005 and 2004, respectively.
- 在連續三、四年減緩後,凍原在2015與2016年卻又開始大大的「綠化」,依據衛星監測紀錄,2016年凍原「綠化」高峰期的面積為35年來整個北極區域的第4名、北極歐亞區的第9名及北極北美區的第3名。
- Tundra greenness has increased substantially throughout the Arctic during 2015 and 2016 (the most recent year with a complete data set) following 3-4 years of continuous declines. Peak tundra greenness for 2016 ranks 4th (entire Arctic), 9th (Eurasian Arctic), and 3rd (North American Arctic) in the context of the 35-year satellite record.
- 在北極好幾個觀測點測得2016年永凍土溫度是1978年以來最高的。自2000年後,本來溫度極低的北極阿拉斯加區、加拿大區及冷岸群島的永凍土的溫度都上昇了。
- Permafrost temperatures in 2016 (the most recent set of complete observations) at many observation sites around the Arctic were among the highest on record (as long as 1978-present, but
duration of records vary). Increases in permafrost temperature, since 2000, have been greatest in cold permafrost of the Alaskan Arctic, Canadian high Arctic, and Svalbard.
以下是我擷取自美國國家冰雪數據中心(NSIDC)的資料,北極冰域在每年夏天九月融冰期面積最小的前十名排行,都發生在2007年之後。而除了2009年,從2007年到2015年已經蟬聯了10年的前十名,可以想見這些年來北極融冰惡化的情形與人類這段期間對地球胡搞瞎攪的關連,你我也是罪魁禍首之一,再不改善,等到北極都沒有冰了,氣候變化到無法想像的地步,海水淹沒大部分家園的時候,再來呼天搶地都沒用了。
|
RANK 排行 |
YEAR 年度 |
MINIMUM ICE EXTENT最小冰域 |
DATE 日期 |
|
|
IN MILLIONS OF SQUARE KILOMETERS 百萬平方公里 |
IN MILLIONS OF SQUARE MILES 百萬平方英哩 |
|||
|
1 |
2012 |
3.39 |
1.31 |
Sept. 17 |
|
2 |
2016 |
4.14 |
1.60 |
Sept. 10 |
|
4 |
2011 |
4.34 |
1.67 |
Sept. 11 |
|
5 |
2015 |
4.43 |
1.71 |
Sept. 9 |
|
6 |
2008 |
4.59 |
1.77 |
Sept. 19 |
|
7 |
2010 |
4.62 |
1.78 |
Sept. 21 |
|
8 |
2017 |
4.64 |
1.79 |
Sept. 13 |
|
9 |
2014 |
5.03 |
1.94 |
Sept. 17 |
|
10 |
2013 |
5.05 |
1.94 |
Sept. 13 |
|
Ten lowest minimum Arctic sea ice extents (satellite record, 1979 to present) |
||||
資料來源:https://nsidc.org/arcticseaicenews/2017/09/arctic-sea-ice-at-minimum-extent-2/
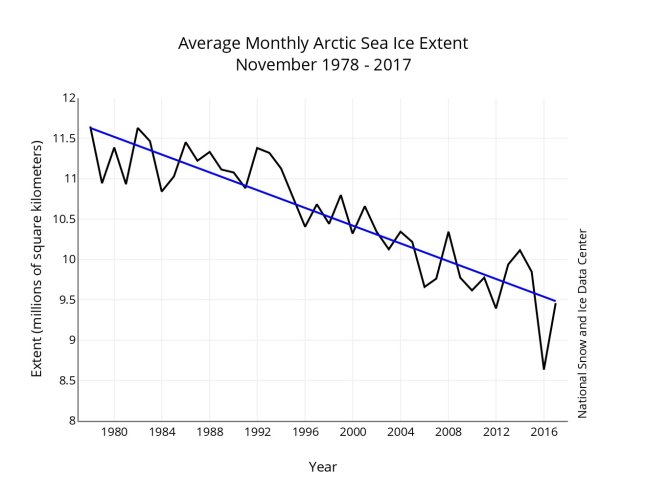 1979-2017每年11月北極冰域範圍呈現一路縮減趨勢,縮減率為每年約5萬5千方公里或每十年5.14%。(The linear rate of sea ice decline for November is 55,000 square kilometers (21,200 square miles) per
下表是我整理美國國家冰雪資料中心的資料,顯示1979-2017各年9月(夏季)北極冰域平均面積數字,可以從數字直接看出2012年是從1979年有衛星探測紀錄以來冰域平均面積最小的一次,2013與2014則有快速回升情形,但2015又縮小到歷史上第四小範圍。此表也可看出1980年代是很穩定的,都有700萬平方公里;1990年代開始有劇烈變化,在100萬平方公里間上下震盪;到了21世紀開始有明顯縮減趨勢,從600多萬平方公里一路縮到近幾年的400多萬平方公里。
|
年度 |
面積(百萬平方公里) |
|
2017 |
4.8 |
|
2016 |
4.5 |
|
2015 |
4.6 |
|
2014 |
5.3 |
|
2013 |
5.6 |
|
2012 |
3.6 |
|
2011 |
4.6 |
|
2010 |
4.9 |
|
2009 |
5.4 |
|
2008 |
4.7 |
|
2007 |
4.3 |
|
2006 |
5.9 |
|
2005 |
5.3 |
|
2004 |
6.0 |
|
2003 |
6.1 |
|
2002 |
6.0 |
|
2001 |
6.8 |
|
2000 |
6.3 |
|
1999 |
6.2 |
|
1998 |
6.6 |
|
1997 |
6.7 |
|
1996 |
7.9 |
|
1995 |
6.1 |
|
1994 |
7.2 |
|
1993 |
6.5 |
|
1992 |
7.5 |
|
1991 |
6.6 |
|
1990 |
6.2 |
|
1989 |
7.0 |
|
1988 |
7.5 |
|
1987 |
7.5 |
|
1986 |
7.5 |
|
1985 |
6.9 |
|
1984 |
7.2 |
|
1983 |
7.5 |
|
1982 |
7.5 |
|
1981 |
7.3 |
|
1980 |
7.8 |
|
1979 |
7.2 |
資料來源:美國國家冰雪資料中心
以下是從1979年到2017年每年9月(冰量最少季節)北極冰域平均範圍圖:(Credit:NSIDC)
 2017/09
 2016/09
 2015/09
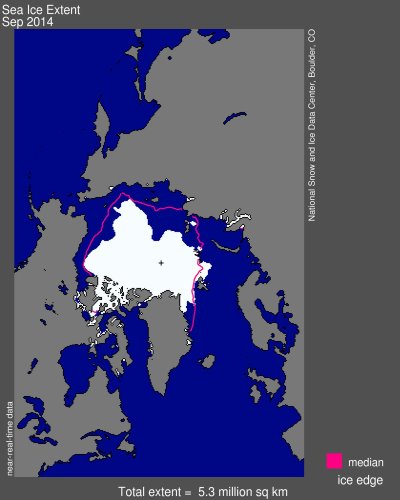 2014/09
 2013/09
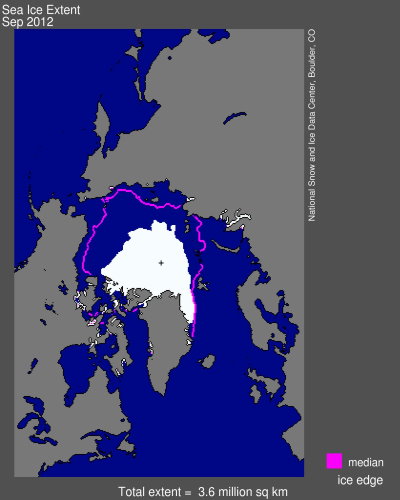 2012/09
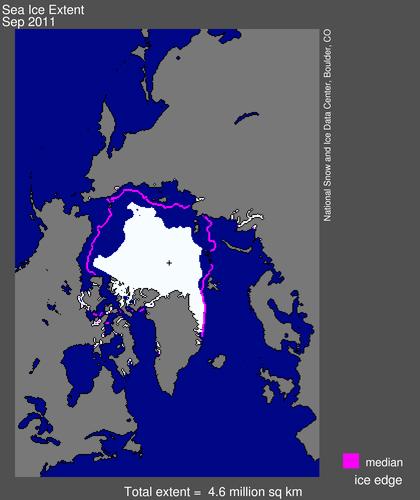 2011/09
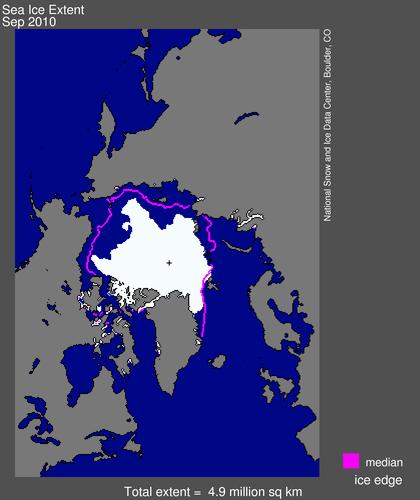 2010/09
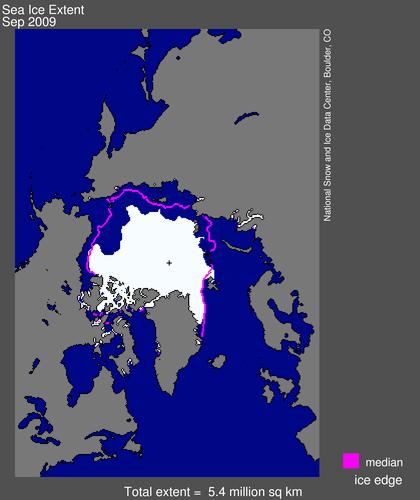 2009/09
 2008/09
 2007/09
 2006/09
 2005/09
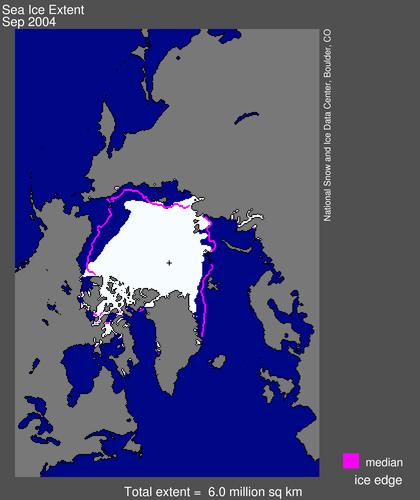 2004/09
 2003/09
 2002/09
 2001/09
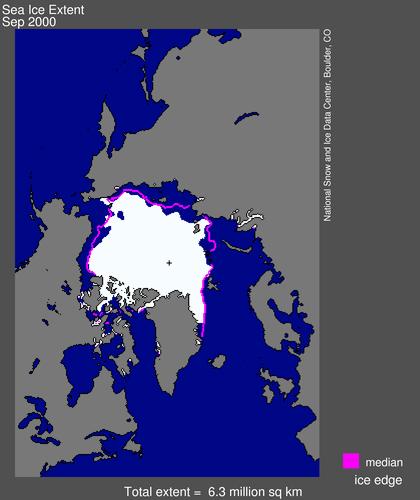 2000/09
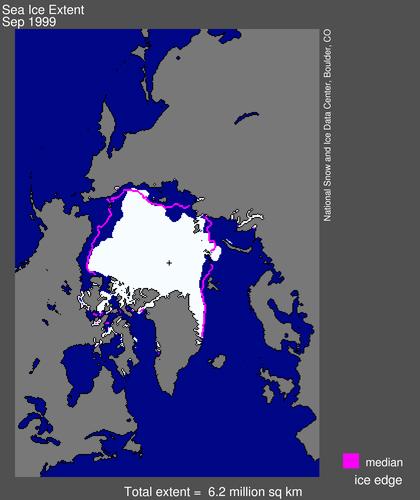 1999/09
 1998/09
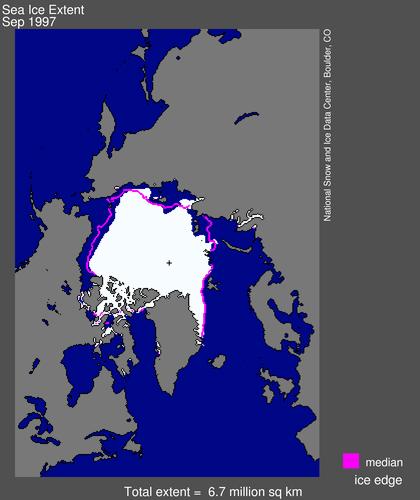 1997/09
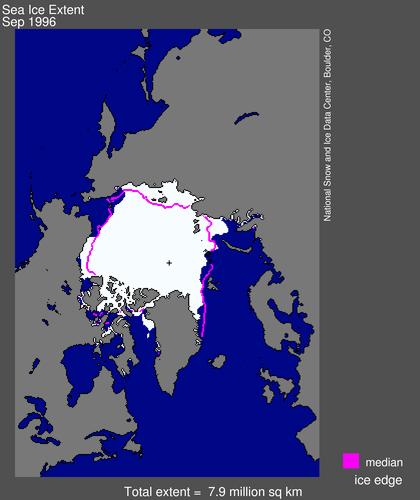 1996/09
 1995/09
 1994/09
 1993/09
 1992/09
 1991/09
 1990/09
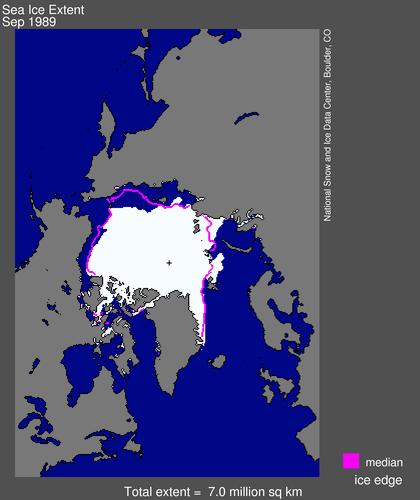 1989/09
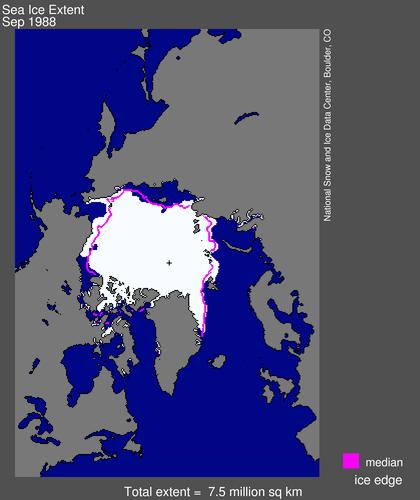 1988/09
 1987/09
 1986/09
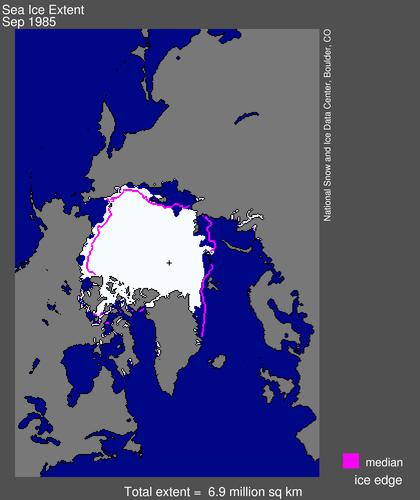 1985/09
 1984/09
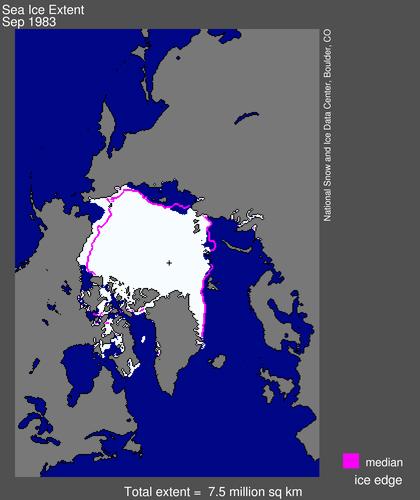 1983/09
 1982/09
 1981/09
 1980/09
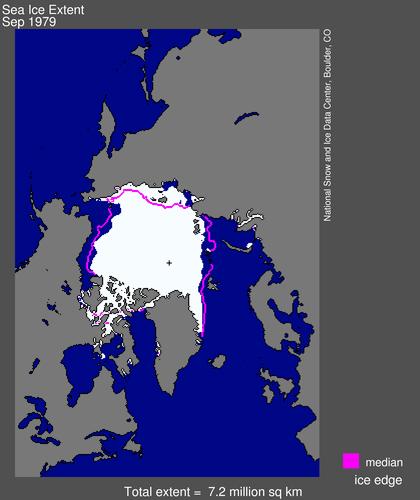 1979/09
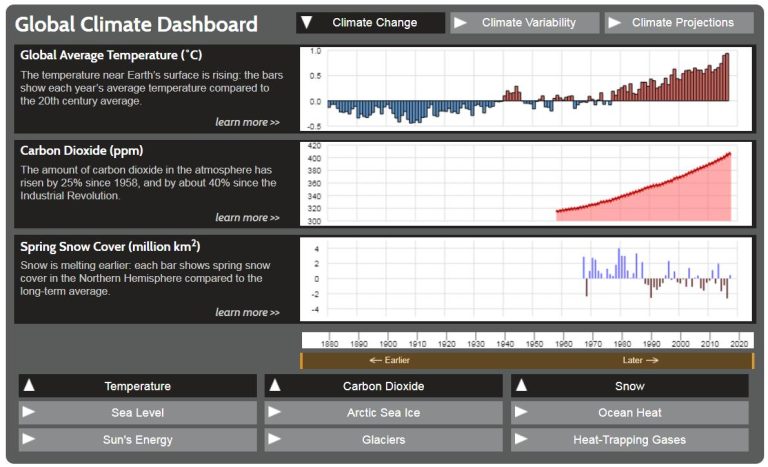
下圖是美國氣候變遷網首頁下方,有個「全球氣候數據統計板」,可以看見歷年及最新有關地球氣候變化的各項資料統計圖。
附註:
美國國家海洋暨大氣總署從2006年起,每年12月提出《北極報告》(Arctic Report Card),這是一本北極各種不同環境系統現狀與歷史對照的紀錄,有最新且由同儕審查明確的、可信的、簡要的環境資訊匯集而成。這本報告用途廣泛,適用於對北極環境與科學有興趣的科學家、教師、學生、決策者以及社會大眾。
The Arctic Report Card (hereafter ‘ARC’) has been issued annually since 2006. It is a timely and peer-reviewed source for clear, reliable and concise environmental information on the current state of different components of the Arctic environmental system relative to historical records. The ARC is intended for a wide audience, including scientists, teachers, students, decision-makers, and the general public interested in the Arctic environment and science.
延伸閱讀:
2020年氣候統計及30秒看地球141年逐漸發燒狀況(影片、圖片、數據)
NASA:2017年是史上第二熱 50秒看地球138年逐漸發燒狀況(影片)
北極冰融得更快了—2016年地球發燒與北極冰況總檢視(數據、圖片、影片)
2016年史上最熱,48秒影片看地球137年逐漸發燒狀況(含2016年全球氣候報告)
本網誌「氣候變遷」專欄各文
中央社外電:「2017為紀錄以來次高溫年 最熱非聖嬰年」


天生萬物以養人,人無一物以報天。