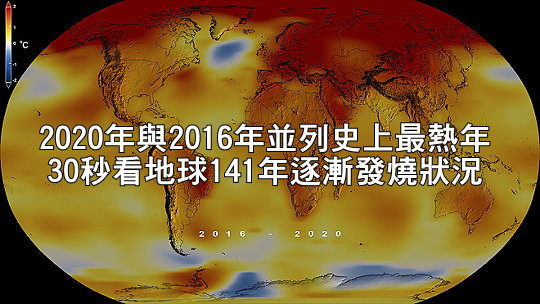
2021年1月國際上主要的氣候監測機構不約而同提出2020年的氣溫統計結論都一樣,歐洲聯盟氣候監測機構哥白尼氣候變化服務中心(Copernicus Climate Change Service)與美國航空暨太空總署(NASA)都指出「2020年與2016年並列為有紀錄以來最熱的一年」(Earth’s global average surface temperature in 2020 tied with 2016 as the warmest year on record),而哥白尼氣候變化服務中心還說「2020年是歐洲有紀錄以來最熱的一年」(2020 warmest year on record for Europe)。
先來看NASA製播的從1880年到2020年141年間地表均溫變化情形,可以看到地球在21世紀後不斷發高燒:(相對於1951-1980年的地表氣溫平均值,1880年至2020年的年均溫顏色愈紅表示地表溫度愈高)
2020年是全球有紀錄以來最熱的一年,與2016年並駕齊驅。 總體而言,自1880年代以來,地球的平均溫度已升高了攝氏1度以上。 由於人類的活動,特別是溫室氣體如二氧化碳和甲烷的排放,溫度正不斷升高。(Earth’s global average surface temperature in 2020 tied with 2016 as the warmest year on record, according to an analysis by NASA. Continuing the planet’s long-term warming trend, the year’s globally averaged temperature was 1.84 degrees Fahrenheit (1.02 degrees Celsius) warmer than the baseline 1951-1980 mean. Temperatures are increasing due to human activities, specifically emissions of greenhouse gases, like carbon dioxide and methane.) Credits: NASA’s Scientific Visualization Studio/Lori Perkins/Kathryn Mersmann
以下是哥白尼氣候變化服務中心相關分析:
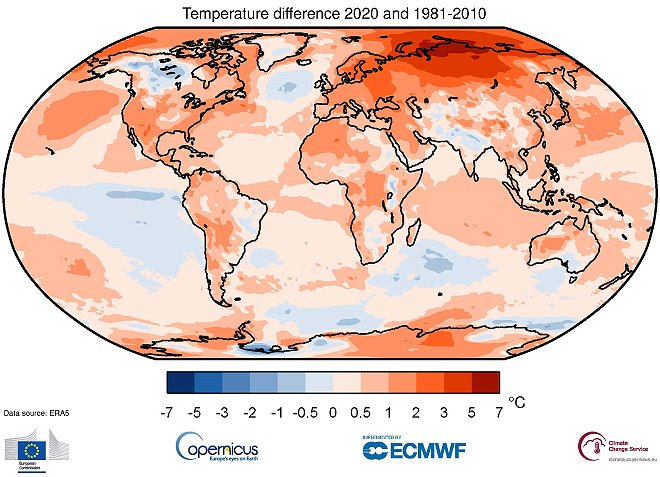
2020年創紀錄的氣溫較工業化前的水準高出攝氏1.25℃ Air temperature at a height of two meters for 2020, shown relative to its 1981–2010 average. Source: ERA5. Credit: Copernicus Climate Change Service/ECMWF
哥白尼氣候變化服務中心(C3S)表示,全球2020年與2016年並列最熱的年份,是從2015年開始連續第六年異常溫暖的年份,也是2011-2020年十年間最溫暖的一年。
The Copernicus Climate Change Service (C3S) today reveals that globally 2020 was tied with the previous warmest year 2016, making it the sixth in a series of exceptionally warm years starting in 2015, and 2011-2020 the warmest decade recorded.
 工業化前時代至今,6個探測計畫每十年的地表均溫的比較,從這圖可以看出,每一家所的的數據大同小異,而從1980年代以來,地球溫度就是急速上升的趨勢。 Decadal averages of global air temperature at a height of two metres estimated change since the pre-industrial period according to different datasets: ERA5 (ECMWF Copernicus Climate Change Service, C3S); GISTEMPv4 (NASA); HadCRUT5 (Met Office Hadley Centre); NOAAGlobalTempv5 (NOAA), JRA-55 (JMA); and Berkeley Earth. Credit: Copernicus Climate Change Service/ECMWF
哥白尼氣候變化服務中心的全球氣溫監測資料顯示
- 2020年全球均溫與2016年相當。
- 2020年比1981-2010年基準期高0.6°C,比1850-1900年工業化前高1.25°C 。
- 過去六年成為有史以來最溫暖的六年。
- 2020年是歐洲有紀錄以來最熱的一年,比1981-2010年基準期高1.6°C,比前一個最熱年份2019年高0.4°C。
- 與1981-2010年平均值相比最大的年度溫差集中在北極和西伯利亞北部,最高溫超過平均值6°C。
C3S’s dataset for surface air temperatures shows that:
- Globally, 2020 was on a par with the 2016 record
- 2020 was 0.6°C warmer than the standard 1981-2010 reference period and around 1.25°C above the 1850-1900 pre-industrial period
- This makes the last six years the warmest six on record
- Europe saw its warmest year on record at 1.6°C above the 1981-2010 reference period, and 0.4°C above 2019, the previous warmest year
- The largest annual temperature deviation from the 1981-2010 average was concentrated over the Arctic and northern Siberia, reaching to over 6°C above average
這裡穿插美國國家海洋暨大氣總署(NOAA)列出從1880到2020年史上最熱的前十名年度:
Ten Warmest Years (1880–2020)
下表列出了有紀錄以來10個最溫暖的年份,及該年度綜合全球陸地和海洋年均溫的排行和跟基準值(1901-2000年)比較之差值。(譯註:2020及2016的升溫值在誤差範圍內,所以視同相當的年份,並列為史上升溫最高的一年。)
The following table lists the global combined land and ocean annually averaged temperature rank and anomaly for each of the 10 warmest years on record.
| RANK 排行 1 = WARMEST 1=最高溫 PERIOD OF RECORD: 1880–2020 溫度紀錄年度區間 |
YEAR 年度 |
ANOMALY °C 攝氏溫差 |
ANOMALY °F 華氏溫差 |
|---|---|---|---|
| 1 | 2016 | 1.00 | 1.80 |
| 2 | 2020 | 0.98 | 1.76 |
| 3 | 2019 | 0.95 | 1.71 |
| 4 | 2015 | 0.93 | 1.67 |
| 5 | 2017 | 0.91 | 1.64 |
| 6 | 2018 | 0.83 | 1.49 |
| 7 | 2014 | 0.74 | 1.33 |
| 8 | 2010 | 0.72 | 1.30 |
| 9 | 2013 | 0.68 | 1.22 |
| 10 | 2005 | 0.67 | 1.21 |
Source: Global Climate Report – Annual 2020, NOAA
英國氣象局列出史上最熱10年的排行:(譯註:2020及2016的升溫值在誤差範圍內,所以視同相當的年份,併列為史上升溫最高的一年。)
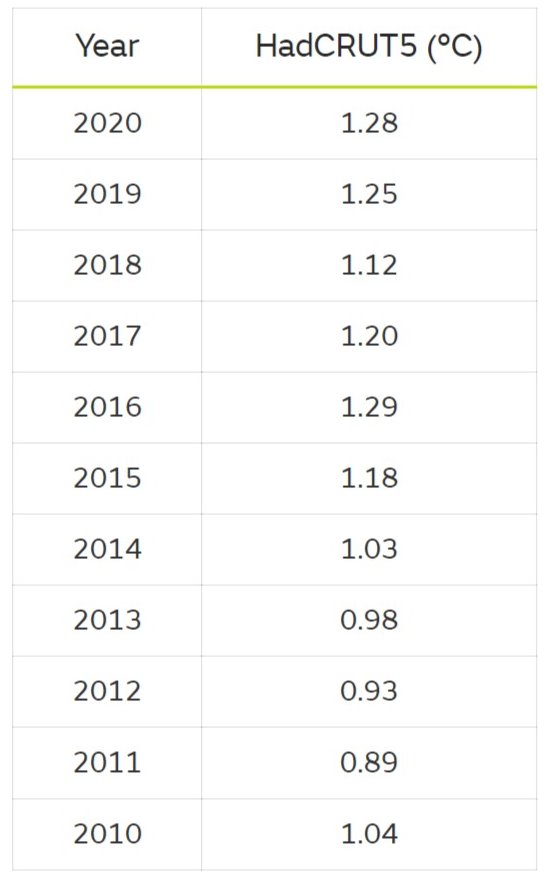 年度均溫與1850-1900年工業化前地表均溫比較之升溫值前十大排行 Global average temperatures (°C) relative to the pre-industrial period 1850-1900 from HadCRUT5. The HadCRUT5 data and other centres’ data can be downloaded from the Met Office Climate Monitoring Dashboard.
而衛星對全球大氣中二氧化碳濃度的測量結果是:
- 全球二氧化碳平均最高排放量達到413 ppm
- 二氧化碳排放量在2020年繼續上升,增長2.3±0.4 ppm,略低於上一年的增長率。
Furthermore, satellite measurements of global atmospheric CO2 concentrations show that:
- CO2 global column-averaged maximum reached 413 ppm
- CO2 continued to rise in 2020, increasing by 2.3 ± 0.4 ppm, slightly less than the growth rate of the previous year
 二氧化碳排放年逐年攀升,以人類活動為主要來源。 Credit: MET Climate Dashboard
北極和西伯利亞北部的部分地區在2020年的年均溫差值最大,大部分地區的全年溫差高達3°C,有些地區甚至超過6°C。 若逐月觀測,該地區最大的正溫度異常可以反覆達到8°C以上。 西伯利亞西部的冬季和春季特別溫暖,而西伯利亞北極地區和北冰洋大部分地區的夏季和秋季也有這種情形。
Parts of the Arctic and northern Siberia saw some of the largest annual temperature deviations from average in 2020, with a large region seeing deviations of as much as 3°C and in some locations even over 6°C for the year as a whole. On a monthly basis, the largest positive temperature anomalies for the region repeatedly reached more than 8°C. Western Siberia experienced an exceptionally warm winter and spring, a pattern is also seen over summer and autumn in the Siberian Arctic and over much of the Arctic Ocean.
此外,該地區的季節性野火也很旺盛,5月首次發現大火以後,整個夏季都在燃燒,一直持續到秋天。 北極圈與極地的野火在2020年排放了創紀錄的244兆噸二氧化碳,比2019年的紀錄增加了三分之一以上。 在2020下半年,北極海冰明顯低於一年中的平均量,其中7月和10月是各月有紀錄以來最小的海冰範圍。
Furthermore, the wildfire season was unusually active in this region, with fires first detected in May, continuing throughout summer and well into autumn. As a result, poleward of the Arctic Circle, fires released a record amount of 244 megatonnes of carbon dioxide in 2020, over a third more than the 2019 record. During the second half of the year, Arctic sea ice was significantly lower than average for the time of the year with July and October seeing the lowest sea ice extent on record for the respective month.
大致上,除北大西洋中部地區外,北半球全年氣溫都高於平均水平。 相反的,南半球部分地區的氣溫低於平均水平,最明顯的是赤道東太平洋地區,這與下半年反聖嬰天氣轉涼有關。 值得注意的是,儘管因反聖嬰現像而有所降溫,但2020年仍達到2016年的高溫紀錄,而2016年創紀錄的高溫肇因於強烈的聖嬰現象。
In general, the Northern Hemisphere experienced above-average temperatures for the year, apart from a region over the central North Atlantic. In contrast, parts of the Southern Hemisphere saw below-average temperatures, most notably over the eastern equatorial Pacific, associated with the cooler La Niña conditions developing during the second half of the year. It is notable that 2020 matches the 2016 record despite a cooling La Niña, whereas 2016 was a record year that began with a strong warming El Niño event.
以下是美國航空暨太空總署對2020年氣候的分析:
我們處在一個正在暖化與改變的世界 A Warming, Changing World
監測全球溫度趨勢顯示了人類活動(特別是溫室氣體排放)對我們星球的影響。 從19世紀末以來,地球的平均溫度已升高了2°F(1.2°C)以上。
溫度上升導致海冰和冰層的損失、海平面上升、更長和更強烈的熱浪以及動植物棲地轉移等現象。 了解這種長期的氣候趨勢對於人類的安全和生活品質至為重要,能使人類以多種方式適應不斷變化的環境,例如種植不同的農作物,管理我們的水資源以及準備面對極端氣候。
Tracking global temperature trends provides a critical indicator of the impact of human activities – specifically, greenhouse gas emissions – on our planet. Earth’s average temperature has risen more than 2 degrees Fahrenheit (1.2 degrees Celsius) since the late 19th century.
Rising temperatures are causing phenomena such as loss of sea ice and ice sheet mass, sea-level rise, longer and more intense heatwaves, and shifts in plant and animal habitats. Understanding such long-term climate trends is essential for the safety and quality of human life, allowing humans to adapt to the changing environment in ways such as planting different crops, managing our water resources, and preparing for extreme weather events.
全球年度平均值玄機 Beyond a Global, Annual Average
儘管長期的變暖趨勢仍持續著,但各種事件和因素都會影響任何一年的平均溫度的高低。 2020年有兩個大事件改變了照射地球表面的陽光量。上半年澳大利亞的森林大火燒毀了4,600萬英畝(約1862公頃)的土地,在大氣中釋放了超過18英哩(29公里)高的煙霧和其他顆粒,阻擋了陽光並可能略微冷卻了大氣。另外,還沒停歇的新型冠狀病毒(COVID-19)大流行導致全球停產減少了許多地區的空氣污染,倒使得更多的陽光可以到達地表,並產生微小但明顯的變暖效應。這些停產措施似乎也減少了二氧化碳的排放量,不過2020年二氧化碳總量卻持續增加,而地球變暖與二氧化碳累積量有關,由此可見2020年並未大幅減少碳的排放量。
While the long-term trend of warming continues, a variety of events and factors contribute to any particular year’s average temperature. Two separate events changed the amount of sunlight reaching the Earth’s surface. The Australian bush fires during the first half of the year burned 46 million acres of land, releasing smoke and other particles more than 18 miles high in the atmosphere, blocking sunlight and likely cooling the atmosphere slightly. In contrast, global shutdowns related to the ongoing coronavirus (COVID-19) pandemic reduced particulate air pollution in many areas, allowing more sunlight to reach the surface and producing a small but potentially significant warming effect. These shutdowns also appear to have reduced the amount of carbon dioxide (CO2) emissions last year, but overall CO2 concentrations continued to increase, and since warming is related to cumulative emissions, the overall amount of avoided warming will be minimal.
強勁的聖嬰現像造成2016年創紀錄的高溫年份,不過2020年缺乏聖嬰現象那樣的升溫助力,這證明了溫室氣體才是造成地球繼續變暖的主因。
“The previous record warm year, 2016, received a significant boost from a strong El Nino. The lack of a similar assist from El Nino this year is evidence that the background climate continues to warm due to greenhouse gases,” Schmidt said.
2020年戈達德太空研究所(GISS)監測與呈現地球全年的平均地表溫度。 當地的天氣對區域溫度變化有重要作用,因此即使在創紀錄的高溫年份中,也不是地球上的每個區域都會有同樣程度的變暖。 根據美國國家海洋暨大氣總署(NOAA)的調查,雖然美國大陸的某些地區在2020年創下了高溫紀錄,但其他地區則沒有。
The 2020 GISS values represent surface temperatures averaged over both the whole globe and the entire year. Local weather plays a role in regional temperature variations, so not every region on Earth experienced similar amounts of warming even in a record year. According to NOAA, parts of the continental United States experienced record high temperatures in 2020, while others did not.
從長期來看,地球部分地區的變暖速度快於其他地區,如北極變暖的趨勢最為明顯,「戈達德太空研究所地表溫度分析」(GISTEMP)資料顯示,過去30年來,北極變暖的速度是全球其他地區的三倍多。 北極海冰的消失(每年的最小面積以每十年13%速率減少)使該地區的陽光反射率降低,這意味著海洋吸收了更多的陽光,溫度進一步上升。 這種現像被稱為「北極放大」,正在進一步加劇海冰的流失、冰層融化和海平面上升、北極更嚴重的火災季節以及永凍土的融化。
In the long term, parts of the globe are also warming faster than others. Earth’s warming trends are most pronounced in the Arctic, which the GISTEMP analysis shows is warming more than three times as fast as the rest of the globe over the past 30 years, according to Schmidt. The loss of Arctic sea ice – whose annual minimum area is declining by about 13 percent per decade – makes the region less reflective, meaning more sunlight is absorbed by the oceans and temperatures rise further still. This phenomenon, known as Arctic amplification, is driving further sea ice loss, ice sheet melt and sea-level rise, more intense Arctic fire seasons, and permafrost melt.
 2020年北極(左圖)、南極(右)平均氣溫相對於1951-1980年平均氣溫之增減,西伯利亞北極地區竟然升高達攝氏6.4度。(The plot on the left shows annual air temperature departures in 2020 from the 1951 to 1980 average for the Arctic, while the plot on the right shows air temperature departures for Antarctica for the same time period.) 取自:NASA
以下是聯合國「世界氣象組織」(World Meteorological Organization, WMO) 發布「2020年全球氣候報告」(The State of the Global Climate 2020)的摘要,請參考:
The State of the Global Climate 2020-WMO
溫室氣體: Greenhouse Gases
大氣中溫室氣體的濃度反映了人類活動與自然來源排放溫室氣體量以及生物圈和海洋吸存溫室氣體量之間的平衡。 自20世紀中葉以來,人類活動造成大氣中溫室氣體含量的增加是氣候變化的主要驅動力。 人類活動導致大氣中溫室氣體含量的增加是氣候變化的主要因素。
Atmospheric concentrations of greenhouse gases reflect a balance between emissions from human activities, natural sources, and biospheric and oceanic sinks. Increasing levels of greenhouse gases in the atmosphere due to human activities are the major driver of climate change since the mid-20th century.
前三大排放溫室氣體 The Big 3
二氧化碳 (CO2)是最具代表性的溫室氣體,甲烷(CH4)與一氧化二氮(N2O)對氣候變遷影響也很大。
2019年大氣中溫室氣體濃度達到新高峰:
二氧化碳 (CO2)有410.5±0.2 ppm,是工業化前的1.48倍。
甲烷(CH4)有1877±2 ppb,是工業化前的2.6倍。
一氧化二氮(N2O)有332.0±0.1 ppb,是工業化前的1.23倍。
Carbon dioxide (CO2) is the most commonly addressed greenhouse gas, and its atmospheric concentration is measured by parts per million (ppm). Methane (CH4) and nitrous oxide (N2O) are also extraordinarily important for the global climate and are measured by parts per billion (ppb).
In 2019, greenhouse gas concentrations reached new highs.
Carbon dioxide: 410.5±0.2 ppm = 148% of preindustrial levels
Methane: 1877±2 ppb = 260% of preindustrial levels
Nitrous oxide: 332.0±0.1 ppb = 123% of pre-industrial levels.

儘管新冠病毒疫情(COVID-19)讓人類活動受挫,不過初步數據顯示2020年全球溫室氣體的排放量還是增加的。
Despite setbacks from COVID-19, preliminary data is showing global greenhouse gas emissions increased in 2020
Credit: World Meteorological Organization – WMO
全球地表均溫: Global Mean Surface Temperature
溫室氣體濃度上升,全球地表均溫(GMST)也跟著上升。 GMST的測量是結合陸地上兩公尺的氣溫和來自各種數據庫的海洋表面溫度,通常以跟基準期比較後的差異值呈現。
As greenhouse gas concentrations rise, so does global mean surface temperature (GMST). GMST is measured using a combination of air temperature two meters over land, and sea surface temperature in ocean areas from various databases typically expressed as an anomaly from a baseline period.
 1850-2020年相對於工業化前的全球均溫從1980年代以來呈現上升趨勢。
2020年,全球溫度比工業化前基準(1850-1900年)高出1.2±0.1℃。
儘管反聖嬰現象降溫條件正在形成,但2020年是有紀錄以來最溫暖的三個年份之一。
最近十年,即2011-2020年,是有紀錄以來最暖的十年。
氣候暖化並非均勻分布在地球各處。
自20世紀80年代中期以來,北極地表空氣的升溫速度至少是全球平均水準的兩倍,而同期海冰、格陵蘭島冰原和冰川卻在減少,永凍層溫度則在增加。
這不僅對北極的人口、基礎設施和生態系統有潛在的重大影響,而且還會對全球氣候產生各種連鎖反應。
In 2020, GMST was 1.2 ± 0.1 °C warmer than the pre-industrial baseline (1850-1900).
Despite developing La Niña cooling conditions, 2020 was one of the three warmest years on record.
The last decade, 2011-2020, is the warmest on record.
Warming does not distribute equally around the planet.
Since the mid-1980s, Arctic surface air temperatures have warmed at least twice as fast as the global average, while sea ice, the Greenland ice sheet, and glaciers have declined over the same period and permafrost temperatures have increased.
This has potentially large implications not only for Arctic population, infrastructure, and ecosystems but also for the global climate through various feedbacks.
極端氣候事件: Extreme Events
全球氣溫上升導致了世界更頻繁、更嚴重的極端氣候事件。
Rising global temperatures have contributed to more frequent and severe extreme weather events around the world.
野火 Fires
2020年夏末秋初,美國西部發生了多起特別大的野火,包括加州和科羅拉多州有史以來最大的火災。
澳大利亞東部的嚴重野火在2019年下半年一直燃燒到2020年初,後因2月初的大雨才得到控制。
A number of exceptionally large wildfires, including the largest fires ever recorded in the states of California and Colorado, occurred in the western United States in late summer and autumn.
Major wildfires in eastern Australia which had burned through the later part of 2019 continued into early 2020, before finally being controlled after heavy rain in early February.
洪水 Flooding
2020年,非洲和亞洲大部分地區發生了大規模的洪水。
繼2019年10月至12月的類似雨季之後,在3月至5月的漫長雨季,非洲大角地區大部分區域的降雨量遠高於歷年平均水平。夏季風期間,從塞內加爾到蘇丹,薩赫勒絕大多數地區的降雨量都高於平均水平。該地區許多地方洪水氾濫,尤其蘇丹和肯亞受災最嚴重,肯亞有285人死亡,蘇丹有155人死亡,87.5萬人受災,連帶還有疾病的影響。
在印度,巴基斯坦,尼泊爾,孟加拉國,阿富汗和緬甸,雨季共有2000多人死亡,其中8月下旬阿富汗的山洪爆發有145人死亡。而在7月初,緬甸一處礦山在暴雨後山體滑坡,死了166人。
中國長江流域在季風季節持續的強降雨也造成了嚴重的洪災,經濟損失超過150億美元,至少有279人死亡。
東南亞部分地區在10月和11月遭受了嚴重洪災。受災最嚴重的地區是越南中部,一系列颱風和低氣壓加劇了東北季風帶來的典型大雨,在不到五週的期間內有八次颱風登陸。
Very extensive flooding occurred over large parts of Africa and Asia in 2020.
Rainfall was well above average in most of the Greater Horn of Africa during the March-May “long rains” season, following a similarly wet season in October-December 2019. This was followed by above-average rainfall across the vast majority of the Sahel region, from Senegal to Sudan, during the summer monsoon. Flooding was extensive across many parts of the region, although Sudan and Kenya were the worst-affected with 285 deaths reported in Kenya, and 155 deaths and 875,000 people affected in Sudan, along with further indirect impacts from disease.
More than 2000 deaths were reported during the season in India, Pakistan, Nepal, Bangladesh, Afghanistan, and Myanmar, including 145 deaths in flash flooding in Afghanistan in late August, and 166 deaths in a landslide at a mine in Myanmar in early July, following heavy rain.
Persistent high rainfall in the Yangtze River catchment in China in the monsoon season also caused severe flooding. Reported economic losses exceeded US$15 billion, and at least 279 deaths were reported during the period.
Parts of southeast Asia experienced severe flooding in October and November. The worst affected area was in central Vietnam, where heavy rains typical of the arrival of the northeast monsoon were exacerbated by a succession of tropical cyclones and depressions, with eight making landfall in less than five weeks.
乾旱 Droughts
2020年,嚴重的乾旱影響了南美內陸的許多地區,最嚴重的是阿根廷北部、巴拉圭和巴西的西部邊界地區。 巴西的農業損失估計約為30億美元,阿根廷,烏拉圭和巴拉圭的損失則更多。
Severe drought affected many parts of interior South America in 2020, with the worst-impacted areas being northern Argentina, Paraguay, and western border areas of Brazil. Estimated agricultural losses were near US$3 billion in Brazil with further losses in Argentina, Uruguay, and Paraguay.
熱浪 Heat Waves
在俄羅斯大部分地區,尤其是西伯利亞,2020年是異常溫暖的一年。俄羅斯1月至8月的平均溫度比歷年均溫高3.7°C,比2007年的最高紀錄高1.5°C。迄今為止,在西伯利亞北部的部分地區,2020年的平均溫度已經比歷年均溫高5°C或更多。
1月4日,雪梨西邊的彭里斯(Penrith)氣溫達到48.9°C,是澳大利亞都會區的最高紀錄,而坎培拉在夏季三個月份都創下了月度紀錄,並在1月4日創下44°C的新高。
4月,一場主要的熱浪影響了加勒比地區和墨西哥。 4月12日,維吉他(Veguitas)的溫度達到了39.7°C,是古巴的最高溫紀錄,而哈瓦那也創下了38.5°C的最熱一天。在墨西哥東部,許多地方的溫度都超過45°C,4月12日在加令那斯(Gallinas)達到48.8°C,而中美洲則包括在瓜地馬拉的聖奧古斯丁·阿薩瓜瓜特蘭的41.2°C最高溫紀錄。 9月進一步的極端炎熱,創下了多明尼加、格瑞納達和波多黎各的國家或地區紀錄。
東亞部分地區面臨炎熱的夏天。日本靜岡縣濱松市在8月17日的41.1°C創下日本全國最高溫紀錄,臺灣台北市在7月24日39.7°C是有紀錄以來最熱的一天。從6月19日到7月1日,香港連續13個晚上都在28°C或更高的溫度,接著7月5日到15日連續11個晚上也是一樣。
2020 has been an exceptionally warm year in most of Russia, especially Siberia. Temperatures averaged over Russia for January to August were 3.7 °C above average, 1.5 °C above the previous record set in 2007. In parts of northern Siberia the year to date has been 5 °C or more above average.
Penrith in western Sydney reached 48.9 °C on 4 January, the highest observed in an Australian metropolitan area, whilst Canberra, which set monthly records in all three summer months, reached a new high of 44.0 °C on the same day.
A major heatwave affected the Caribbean region and Mexico in April. Temperatures reached 39.7 °C at Veguitas on 12 April, a national record for Cuba, whilst Havana also had its hottest day with 38.5 °C. In eastern Mexico temperatures exceeded 45 °C at a number of locations, reaching as high as 48.8 °C at Gallinas on 12 April, whilst very high readings in Central America included 41.2 °C at San Agustin Acasaguatlan (Guatemala). Further extreme heat in September saw national or territorial records set for Dominica, Grenada and Puerto Rico.
It was a very hot summer in parts of East Asia. Hamamatsu (41.1 °C) equaled Japan’s national record on 17 August, and Taipei had its hottest day on record with 39.7 °C on 24 July. Hong Kong had a record run of 13 consecutive nights of 28 °C or above from 19 June to 1 July, then followed with an 11-night sequence from 5 to 15 July.
寒潮 Cold Waves
1月17日至18日,紐芬蘭發生了北美地區最嚴重的2019-2020年冬季暴風雪。聖約翰島的降雪量為75厘米,包括創下日降雪量及每小時126公里的狂風紀錄。在2020年後期,秋季提早出現了兩次極端的寒潮。
在9月的第二週,科羅拉多州的低地,包括丹佛市,發生了大範圍的降雪,而在3天前的9月5日才創下9月的最高溫紀錄38.3°C。接著在10月,一場嚴重的寒潮爆發讓洛磯山脈和中部各州的廣大地區帶來了異常低溫和冬季降水。奧克拉荷馬市一場破壞性的冰暴使得全市一半以上的地區停電數日,而更遠的北部蒙大拿州的波托馬克則在10月25日達到-33.9°C,這是美國任何地方(不包括阿拉斯加)的測候站溫度降至-30°C以下的最早秋季日期。
南美洲南部也面對一個寒冷的冬天。火地島在6月下旬和7月上旬出現了1995年以來最顯著的寒流,里奧格蘭德州的最高氣溫為-8.8°C,最低氣溫為-16.5°C。巴拉圭許多地方都刷下8月的最低溫紀錄。巴塔哥尼亞有自2000年以來第二大的積雪量,火地島部分海岸地區更出現了海冰。
North America’s most significant snowstorm of the 2019-20 winter occurred on 17-18 January in Newfoundland. St. John’s received 75 cm of snow, including a record daily snowfall, and wind gusts of 126 km/h. Later in the year, there were two extreme early-season cold episodes in autumn.
In the second week of September, widespread snowfalls occurred in lowland Colorado, including Denver, where a September record high of 38.3 °C had been set only three days earlier on the 5th. Later, in October, a major cold outbreak brought exceptionally low temperatures and winter precipitation across a broad region of the Rocky Mountains and central states. A damaging ice storm in Oklahoma City saw power outages which lasted for days across more than half the city, whilst further north, Potomac, Montana reached −33.9 °C on 25 October, the earliest autumn date on which temperatures had fallen below −30 °C at a climate station anywhere in the United States (excluding Alaska).
It was a cold winter in southern South America. Tierra del Fuego had its most significant cold spell since 1995 in late June and early July, with the Rio Grande recording a maximum of −8.8 °C and a minimum of −16.5 °C on 1 July. Paraguay saw record minimum temperatures for August in a number of places. Snow cover in Patagonia was second-most extensive since 2000 and sea ice formed along with parts of the Tierra del Fuego coast.
暴風雨 Severe Storms
颱風(颶風) Cyclones
最強的風暴是戈尼(羅利)颱風。它在11月1日穿過菲律賓北部,剛登陸時的10分鐘,風速達到每小時220公里,是有紀錄以來登陸強度最大的風暴之一。隨後一周,瓦姆科(尤利西斯)颱風登陸,雖然強度較小,但在馬尼拉和其他地區造成了嚴重的洪災。
9月初幾天,連續兩個颱風襲擊朝鮮半島,9月3日邁薩克(朱利安)颱風登陸釜山附近,海神(克里斯汀)颱風緊接著在7日登陸。 十月份不到三週時間裡,四個颱風和熱帶低氣壓登陸越南,造成了該地區的嚴重洪災。
其他造成水災導致重大生命損失的熱帶氣旋是1月在馬達加斯加的黛安颶風,5月在瓜地馬拉和薩爾瓦多的阿曼達熱帶風暴。
The strongest storm of the season was Typhoon Goni (Rolly). It crossed the northern Philippines on 1 November with a 10-minute mean wind speed of 220 km/h at its initial landfall, making it one of the most intense landfalls on record. This was followed the next week by Vamco (Ulysses), which was less intense but caused severe flooding in Manila and other areas.
Two major cyclones hit the Korean Peninsula within a few days in early September, with Typhoon Maysak (Julian) making landfall near Busan on 3 September, followed by Haishen (Kristine) on the 7th. Four tropical cyclones and a tropical depression made landfall in Vietnam in less than three weeks in October, contributing to major flooding in the region.
Other tropical cyclones that caused significant loss of life through flooding were Cyclone Diane in Madagascar in January, and Tropical Storm Amanda in Guatemala and El Salvador in May.
暴風雨 Storms
2020年代價最慘重的極端事件之一是8月10日橫跨美國中西部地區,從南達科他州延伸到俄亥俄州的強對流風暴(發生時出現雷雨,伴隨著持續時間長、破壞性強的大風,襲擊範圍廣)。愛荷華州是受影響最嚴重的地區,農業損失嚴重,包括估計有200萬公頃的玉米和大豆作物被夷為平地。
1月第三周,嚴重的大雷雨影響了澳大利亞東部的廣大地區。2月,一些嚴重的颶風影響到北歐、中歐和西歐,導致這個月非常潮濕,有些地區還發生洪水。
One of the most costly extreme events of the year was a derecho (fast-moving line of severe thunderstorms) which moved across the U.S. Midwest on 10 August, extending from South Dakota to Ohio. Iowa was the worst-affected area, with severe agricultural losses, including an estimated 2 million hectares of corn and soybean crops flattened.
Severe thunderstorms affected a wide area of eastern Australia in the third week of January. A number of severe extratropical cyclones affected northern, central, and western Europe in February, contributing to a very wet month with flooding in some areas.
海洋熱含量 Ocean Heat Content
由於溫室氣體濃度的增加,大約90%積聚在地球系統中的多餘能量會進到海洋。海洋熱含量(OHC)就是這種熱量積累的量度值,是在海洋各種深度(最深達到2000公尺)進行測量。
所有數據都顯示,在過去的二十年中,任何海洋深度的升溫速率都呈現特別劇烈的增長。
Around 90% of the excess energy that accumulates in the earth system due to increasing concentrations of greenhouse gases, goes into the ocean.
Ocean Heat Content (OHC) is a measure of this heat accumulation in the Earth system. It is measured at various ocean depths, up to 2000m deep.
All data sets agree that ocean warming rates show a particularly strong increase in the past two decades and across all depths.
 此圖呈現1960-2019年全球海洋熱含量(OHC)相對於基準期2005-2017年0-300公尺(灰色)、0-700公尺(藍色)、0-2000公尺(黃色)和700-2000公尺深度層(綠色)的差異值和標準差(2-sigma,陰影部分)。
海洋熱浪:截至2020年,82%的海洋至少都遭遇過一次海洋熱浪,對海洋生物和賴以生存的社區造成重大影響。
海洋變暖會增加體積。 熱膨脹以及格陵蘭、南極和冰川的融化正導致全球海平面上升。
Marine Heatwaves:To date in 2020, 82% of the ocean experienced at least one MHW, causing significant impacts to marine life and the communities that depend on it.
As the ocean warms, its volume increases. Thermal expansion, as well as the melting of Greenland, the Antarctic, and glaciers all over the world are causing sea levels to rise.
底下穿插美國國家海洋暨大氣總署(NOAA)有關海洋熱含量的統計表與圖:
|
BASIN 海域 |
0-700 METERS 公尺深度 RANK (1955-2020) 與1955-2020基準比較之排行 |
|||||
|---|---|---|---|---|---|---|
| ENTIRE BASIN 整個海域 |
NORTHERN HEMISPHERE 北半球 |
SOUTHERN HEMISPHERE 南半球 |
||||
| Atlantic 大西洋 | 7.459 | 2nd第2名 | 4.057 | 2nd第2名 | 3.402 | 1st第1名 |
| Indian 印度洋 | 3.427 | 9th第9名 | 0.922 | 2nd第2名 | 2.506 | 10th第10名 |
| Pacific 太平洋 | 6.638 | 2nd第2名 | 3.335 | 2nd第2名 | 3.302 | 4th第4名 |
| World 全球 | 17.524 | 2nd第2名 | 8.314 | 1st | 9.210 | 4th第4名 |
| Source: Basin time series of heat content | ||||||
 2020年全球海洋0-700公尺深度之熱含量圖,橘色愈深表示熱含量愈高,可以看出整個海洋幾乎就是一片「火海」。 Source: 2020 Global Climate Report-NCDC
海平面上升 Sea Level Rise
全球海平面每年平均上升3.29(+/- 0.3)厘米,並在2020年達到高峰。2020年下半年的小幅下降很可能與熱帶太平洋的反聖嬰現象有關。
Globally, sea level has been rising an average of 3.29 (+/- 0.3) mm per year, peaking in 2020. A small decrease in the latter part of 2020 is likely related to La Niña conditions in the tropical Pacific.
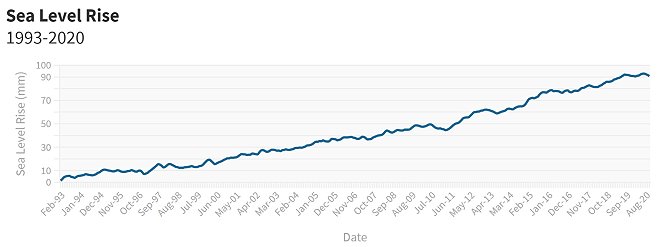 1993-2020海平面上升高度(單位:厘米) Credit: World Meteorological Organization
海平面上升速率推估以及對人類生活的影響 Credit: NASA Climate Change
冰川消融 Glacial Mass
包括冰原在內的冰川遍布地球各處,但集中在亞洲、北美洲和南美洲的高山山脈,供應全世界數百萬人生態系服務與淡水,冰川流失對全球氣候和永續發展都有重大和直接的影響。
Glaciers, including ice sheets, are distributed across the planet, with concentrations in the high mountain ranges of Asia, and North and South America. As providers of ecosystem services and freshwater supply to millions around the world, the glacial loss has significant and direct impacts on both the global climate and sustainable development.
以下三張對比圖顯示冰川急速消融狀況:
 美國阿拉斯加州「哥倫比亞冰川」,2009(左)對照2015(右)。 Columbia Glacier, Alaska, 2009(left)2015(right)-James Balog
 美國阿拉斯加州「門登霍爾冰川」,2007(左)對照2015(右)。 Mendenhall Glacier, Alaska,2007(left) 2015(right)-James Balog
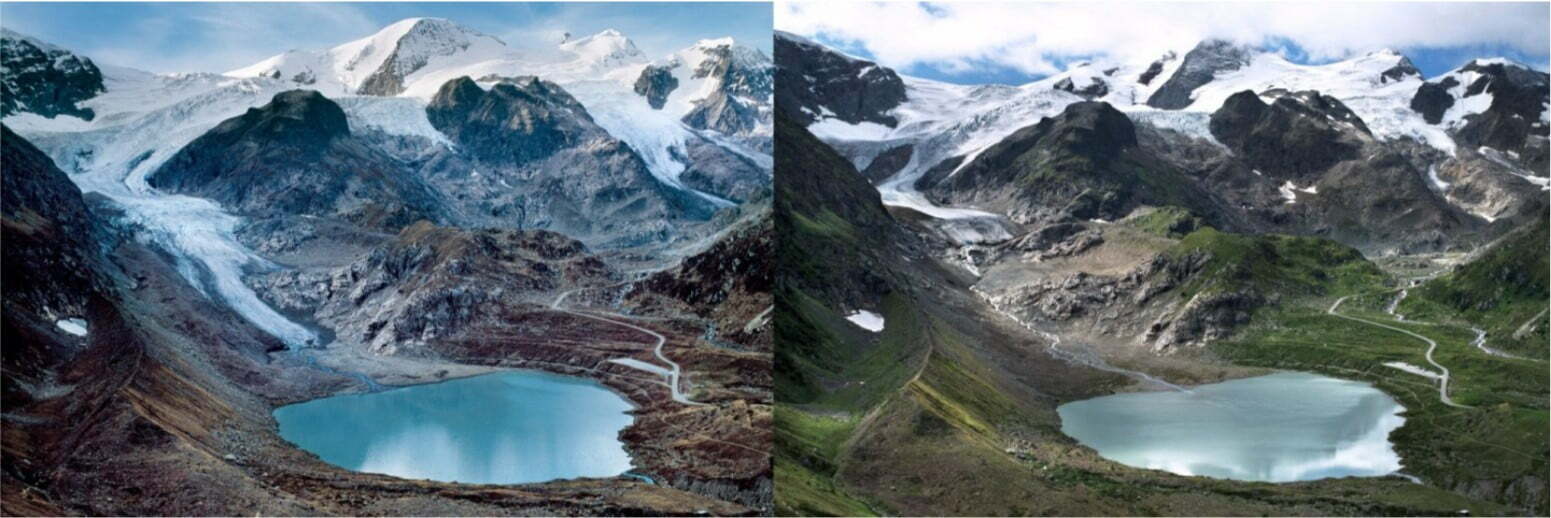 瑞士阿爾卑斯山脈「斯坦因冰川」,2006(左)對照2015(右)。 Stein Glacier-Switzerland, 2006(left) 2015(right)-James Balog
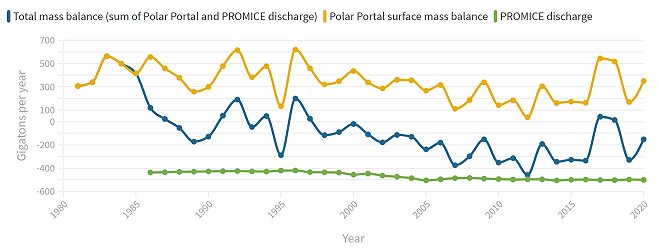 格陵蘭冰原持續消融。綠線是格陵蘭冰原監測計畫測得格陵蘭冰原消融統計,黃線是丹麥科學機構監測格陵蘭表層冰變化統計,藍線是前兩者加總情形。雖然表層冰的增消接近長期平均水平,但冰山崩裂造成冰的流失是40年衛星紀錄的最高值。 在2019年9月至2020年8月之間,冰原總共損失了約1520億噸的冰。
The Greenland ice sheet continued to lose mass. Although the surface mass balance was close to the long-term average, loss of ice due to iceberg calving was at the high end of the 40-year satellite record. In total, approximately 152 Gt of ice were lost from the ice sheet between September 2019 and August 2020.
(譯註:
1. Gt,gigaton的縮寫,是十億公噸。
2. POLAR PORTAL 是丹麥科學機構監測北極冰與氣候的計畫
2. PROMICE 是格陵蘭冰原監測計畫(Programme for Monitoring of the Greenland Ice Sheet)的縮寫)
海冰縮減 Sea Ice Extent
海冰可以作為氣候變化的指標,特別是衡量兩極冰域變化的速率有多快,以及其覆蓋範圍大小的影響。
Sea ice serves as a useful indicator of climate change particularly given how quickly change occurs at the poles and how widespread the repercussions of its cover can be.
2020年南極海冰範圍仍接近長期的平均水平。
While Antarctic sea ice remained close to the long-term average.

此圖顯示二個監測計畫統計南極海冰歷年9月覆蓋最廣和2月覆蓋最小的面積與1981-2010年平均面積之差的變化。 Sea-ice extent difference from the 1981-2010 average in the Antarctic for the months with maximum ice cover (September) and minimum ice cover (February).
2020年北極測得有紀錄以來第二低的海冰範圍,並且在7月和10月觀察到該月創紀錄的最小海冰範圍。
In the Arctic, the annual minimum sea-ice extent was the second-lowest on record, and record low sea-ice extents were observed in the months of July and October 2020.
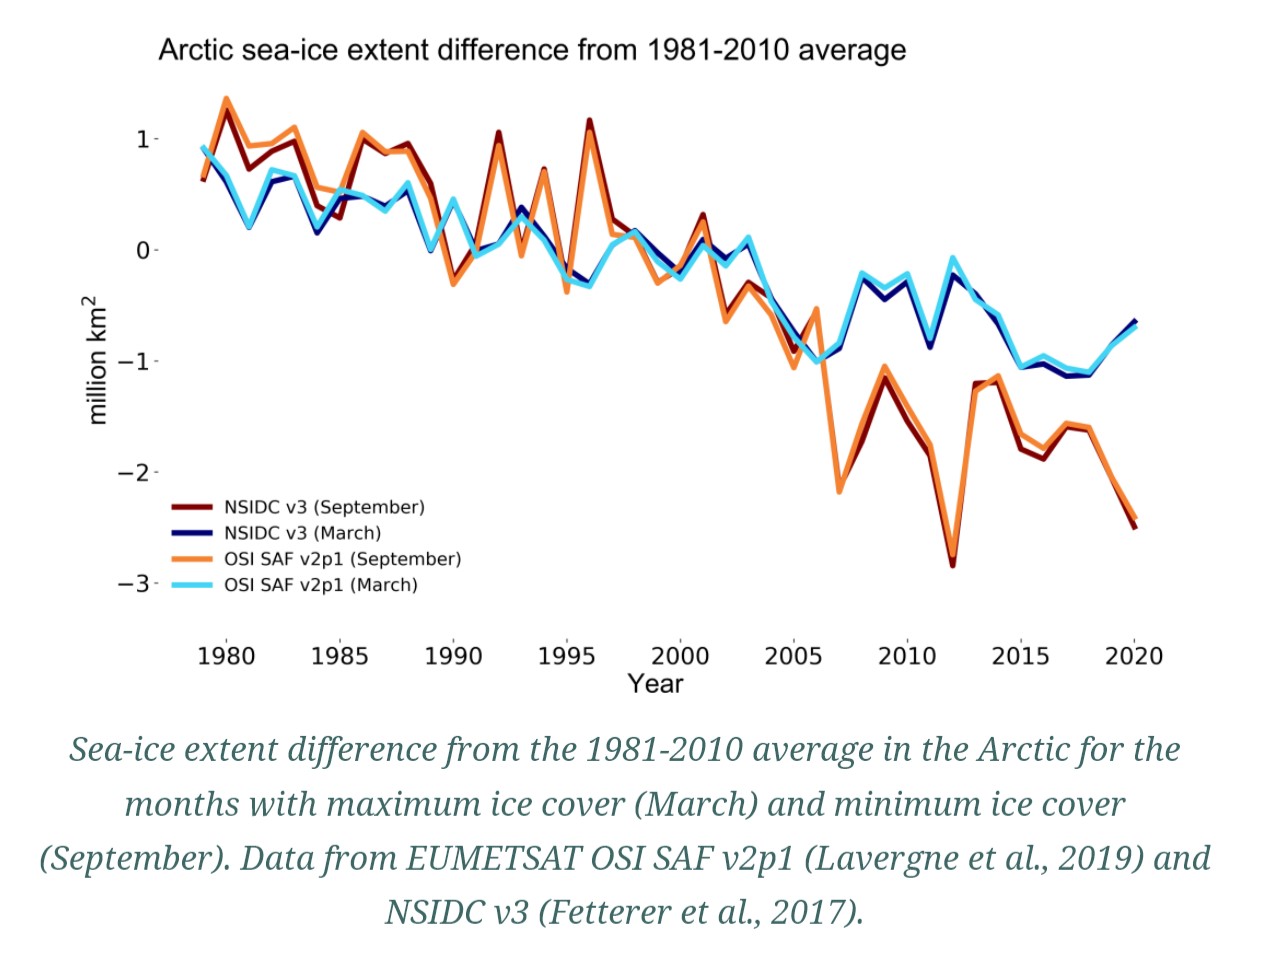 此圖顯示二個監測計畫統計北極歷年3月最多冰時與9月最少冰時相對1981-2010年平均面積之差的變化。
底下穿插美國國家海洋暨大氣總署(NOAA)發布2020年9月北極海冰範圍是史上第二低紀錄的統計圖(2020 Arctic sea ice minimum second-lowest on record):
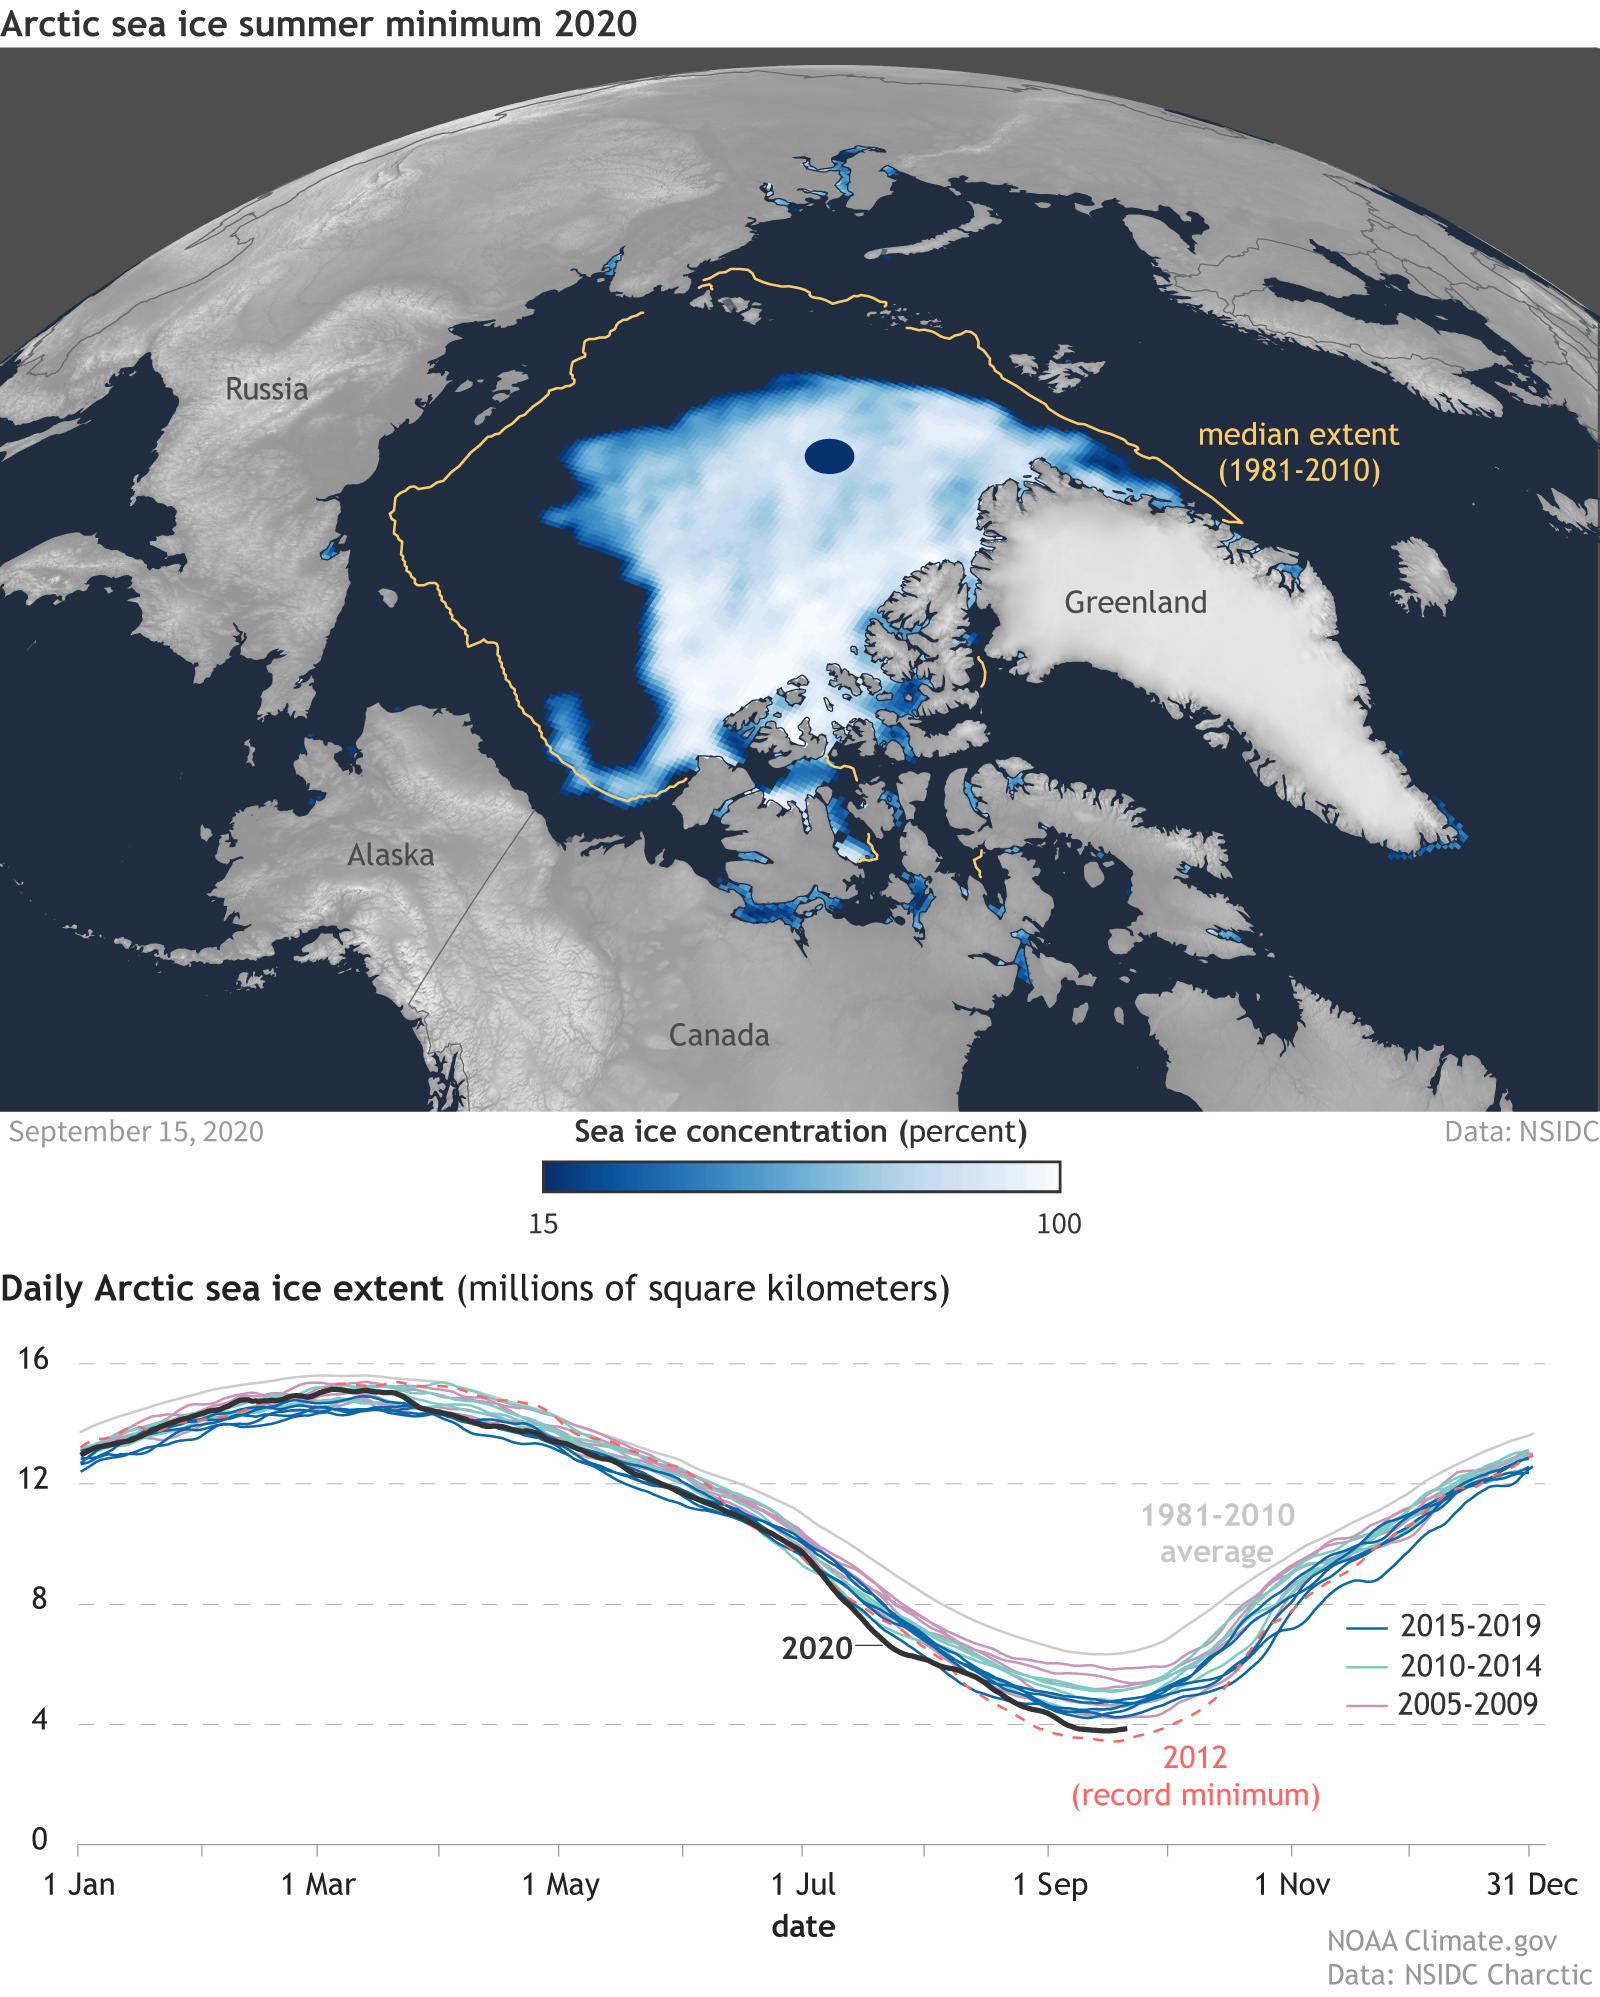 上圖:2020年9月15日北極海冰範圍(白色部分),面積是374萬平方公里(3.74 million square kilometers),褐色線是1981-2010年北極海冰範圍的中位數線。 下圖:2020年北極海冰每日範圍變化線(黑色粗線,統計到9月15日)與2012年(紅色虛線)、2015-2019年(綠線)、2010-2014年(淺藍色線)、2005-2009年(褐色線)、1981-2010平均值(灰色線)之比較,單位:百萬平方公里。 (譯註:北極海冰範圍史上最低紀錄是2012年9月17日的339萬平方公里。)
海洋酸化 Ocean Acidification
二氧化碳濃度上升的影響之一是海洋酸化。海洋吸收了23%每年人為排放到大氣中的二氧化碳,雖有助於減輕氣候變化的影響,海洋生態卻要付出很高的代價。
One impact of rising CO2 concentration is ocean acidification. The ocean absorbs around 23% of the annual emissions of anthropogenic CO2 to the atmosphere, helping to alleviate the impacts of climate change but at a high ecological cost to the ocean.
二氧化碳與海水發生反應,增加海水的酸度,這有害漁業和水產養殖業的發展,從而危及生物和生態系統服務,包括糧食安全。它還弱化了保護海岸線的珊瑚礁,也影響到旅遊業。
CO2 reacts with seawater and increases its acidity. It endangers organisms and ecosystem services, including food security, by endangering fisheries and aquaculture. It also affects coastal protection by weakening coral reefs, which shield the coastline, and tourism.
下圖呈現全球海洋平均酸鹼值急遽下降,朝酸化方向前進。 Global mean ocean pH has been steadily declining:

這麼多的資訊,希望有人耐心看完。
2020年是個不平靜的年,有全球蔓延的新冠病毒疫情,有氣候災情,也創下不少新的(但不好的)氣候監測紀錄,而這些都還在進行式。環境要改善不容易,要毀壞卻在彈指之間。人類不悔改, 環境問題只有愈來愈嚴重,以上這些氣候資料,尤其是創紀錄的部分,不會到此為止,可以預期將來還是會有更惡劣的紀錄產生,大家自求多福了。
延伸閱讀:
2019年氣候統計及30秒看地球140年逐漸發燒狀況(影片、圖片、數據)
2020至2024年這五年中,地球將可能再創高溫紀錄(中英對照)


地球暖化是歷史上一直存在的問題,這個現像可能引起社會騷動不安,甚至於國家政權傾覆。
我國及歐洲歷史紀錄的朝代更迭,也都和地球暖化後的小冰河期有關。