2019年6月開始(註),澳洲東部發生有史以來最大森林野火,蔓延至今未消,已有34人遇難,估計有10億隻動物葬身火海,5900多棟建築被燒毀,火災面積超過1860萬公頃。燒了超過半年,損失慘重,後患無窮,2020年1月15日,澳洲總理莫里森終於承認氣候變遷是真實的,一改之前否認野火跟氣候變遷有所關聯的立場。(註:有說7月,有說9月,本文採維基百科資料。)
許多人,尤其是很多知識份子及政治人物(如美國總統川普之流),一再漠視科學界提出來的各種證據,不承認人為造成的地球暖化、氣候變遷事實,不願改變揮霍積習,不為後代子孫著想,全球還沒有共識共體時艱,一齊以最大努力改善氣候變遷問題。於是,地球環境現狀愈來愈不樂觀,從最近發布的《2019年全球氣候報告》(Global Climate Report – Annual 2019)及《2019年北極報告》(2019 Arctic Report Card)可見一斑。我翻譯部分資料並彙整於此,讓大家了解2019年氣候變化警訊,也可以作為最新的環境教育素材,並請大家設想一下如果繼續惡化下去,大家的日子將要怎麼過?
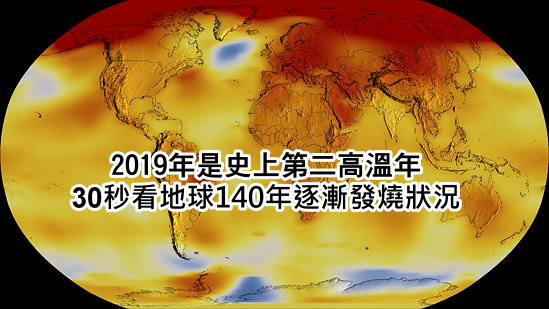
先來看美國航空暨太空總署(NASA)製播的從1880年到2019年140年間地表均溫變化情形,可以看到地球正在發高燒:(相對於1951-1980年的地表氣溫平均值,1880年至2019年的年均溫顏色愈紅表示溫度愈高)
30秒看地球140年逐漸發燒狀況(影片自由下載處:https://svs.gsfc.nasa.gov/13516) 來源:NASA, NOAA Analyses Reveal 2019 Second Warmest Year on Record
NASA紐約戈達德太空實驗室(GISS)表示,2019年全球平均表面溫度比19世紀末高攝氏1.1度,僅次於2016年,並持續地球長期暖化的趨勢:儀器記錄最熱的六個年份就是最近六年。
The average global surface temperature in 2019 was 2 degrees Fahrenheit (1.1 degrees Celsius) warmer than the late 19th Century, according to scientists at NASA’s Goddard Institute for Space Studies (GISS) in New York. It was second only to those of 2016 and continued the planet’s long-term warming trend: the six warmest years on the instrumental record have been the six last years.
以下是美國航空暨太空總署(NASA)會同美國國家海洋暨大氣總署(NOAA)在2020年1月15日發布的《2019年全球氣候報告》部分圖表:
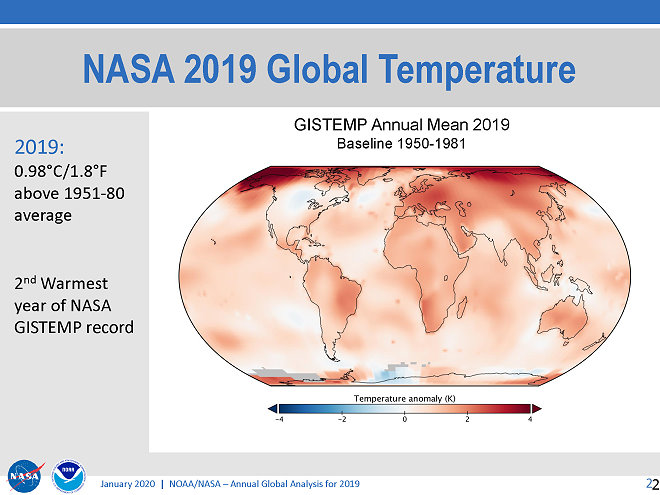 相對於1951-1980年的地表均溫,2019年高出0.98°C,是史上第二高溫年。
2020年1月15日發布的新聞內容說:
自從1880年開始有現代溫度紀錄以來,2019年的全球地表溫度是史上第二高。
全球2019年的溫度僅次於2016年,並延續了地球長期變暖的趨勢:最近五年是過去140年來最溫暖的數年。
Earth’s global surface temperatures in 2019 were the second warmest since modern recordkeeping began in 1880.
Globally, 2019 temperatures were second only to those of 2016 and continued the planet’s long-term warming trend: the past five years have been the warmest of the last 140 years.
 5個科學機構監測統計1880到2019年地表均溫的曲線幾乎一致,而從1980年代以後溫度升高的趨勢也一樣。
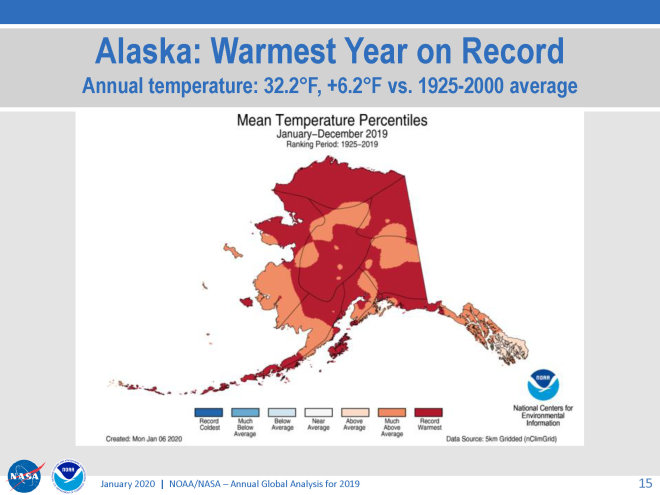 美國阿拉斯加州2019年均溫32.2°F(0.11°C),比1925-2000年均溫高出6.2°F,是史上溫度最高一年。
 圖示1980-2019年美國發生乾旱、洪水、嚴寒、颶風、野火等造成10億美元經濟損失的氣候災變次數,左欄是次數,右欄是經濟損失(單位:10億美元)。2019有14次紀錄,損失4千億美元(包含450億的直接損失),跟2018年並列史上第四大氣候災損年。
底下是《2019年全球氣候報告》的摘要:
全球溫度
2019年是140年地球溫度紀錄中第二高的年份,全球陸地和海洋表面溫度都比平均值高0.95°C,僅比2016年記錄到的+ 0.99°C的最高溫低了0.04°C,比2015年的第三高溫+ 0.93°C只多了0.02°C。 1880-2019年紀錄中最溫暖的5年都發生在2015年以後,而10個最溫暖的年份中有9個是從2005年以來發生的。1998年目前是有紀錄以來最熱的第10名。 2019年則是從1977年以來連續第43年全球陸地和海洋溫度都高於20世紀的平均溫度。
自1880年以來,全球年均溫以每十年0.07°C的速度增長,而1981年以後則以逾兩倍速(+0.18°C )增加。
Global Temperatures
The year 2019 was the second warmest year in the 140-year record, with a global land and ocean surface temperature departure from average of +0.95°C (+1.71°F). This value is only 0.04°C (0.07°F) less than the record high value of +0.99°C (+1.78°F) set in 2016 and 0.02°C (0.04°F) higher than the now third highest value set in 2015 (+0.93°C / +1.67°F). The five warmest years in the 1880–2019 record have all occurred since 2015, while nine of the 10 warmest years have occurred since 2005. The year 1998 currently ranks as the 10 warmest year on record. The year 2019 marks the 43rd consecutive year (since 1977) with global land and ocean temperatures, at least nominally, above the 20th-century average.
The global annual temperature has increased at an average rate of 0.07°C (0.13°F) per decade since 1880 and over twice that rate (+0.18°C / +0.32°F) since 1981.
1880年至2019年最暖的十年排行表 Ten Warmest Years (1880–2019)
下表列出了1880年至2019年全球陸地和海洋綜合年平均溫度最暖的十年排行,以及和140年平均溫度的比較值。
The following table lists the global combined land and ocean annually averaged temperature rank and anomaly for each of the 10 warmest years on record.
| RANK 排行 1 = WARMEST 1=最熱 PERIOD OF RECORD: 1880–2019 統計年份:1880-2019 |
YEAR
年度 |
ANOMALY °C
與平均值比較 攝氏度 |
ANOMALY °F
與平均值比較 華氏度 |
|---|---|---|---|
| 1 | 2016 | 0.99 | 1.78 |
| 2 | 2019 | 0.95 | 1.71 |
| 3 | 2015 | 0.93 | 1.67 |
| 4 | 2017 | 0.91 | 1.64 |
| 5 | 2018 | 0.83 | 1.49 |
| 6 | 2014 | 0.74 | 1.33 |
| 7 | 2010 | 0.72 | 1.30 |
| 8 (tied) 2005與2013相同排行 | 2005 | 0.67 | 1.21 |
| 8 (tied) 2005與2013相同排行 | 2013 | 0.67 | 1.21 |
| 10 | 1998 | 0.65 | 1.17 |
接著是《2019年北極報告》(Arctic Report Card 2019) 重點內容,先看摘要影片:
《2019年北極報告》影片 Arctic Report Card 2019
以下是報告摘要:
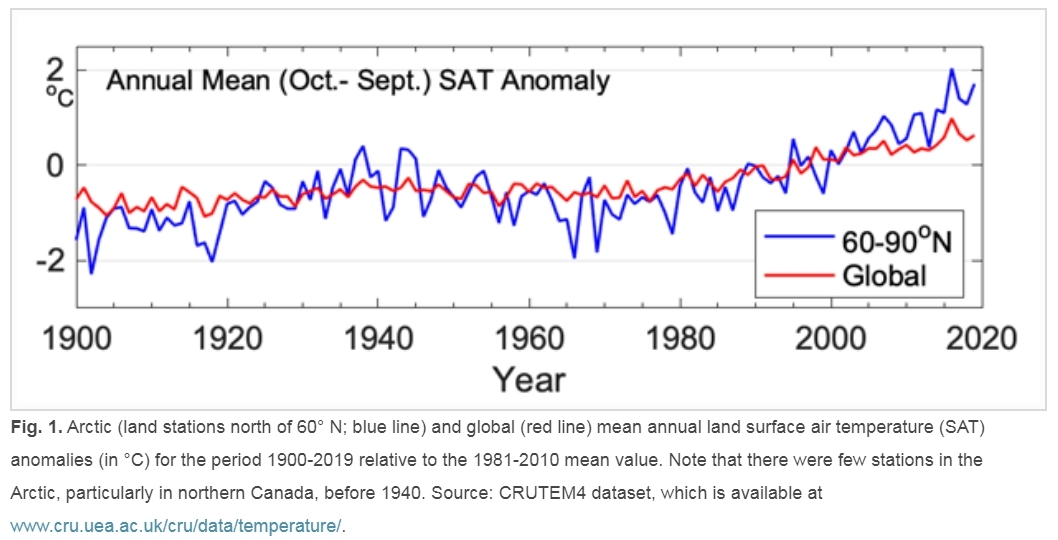
2018年10月至2019年8月北緯60°以北的地表年均溫是1900年以來第二高的溫度。不斷升高的氣溫正在推動北極環境的改變,從而影響區域和全球規模的生態系統與族群。
The average annual land surface air temperature north of 60° N for October 2018-August 2019 was the second warmest since 1900. The warming air temperatures are driving changes in the Arctic environment that affect ecosystems and communities on a regional and global scale.
格陵蘭冰棚每年損失近2670億公噸的冰,目前正以每年1.7毫米速度推進全球平均海平面上升。
The Greenland Ice Sheet is losing nearly 267 billion metric tons of ice per year and currently contributing to the global average sea-level rise at a rate of about 0.7 mm yr-1.
2019年5月,北美北極地區的積雪是53年來的第五低記錄, 6月的積雪則是第三低的。
North American Arctic snow cover in May 2019 was the fifth lowest in 53 years of record. June snow cover was the third-lowest.
北極苔原持續綠化,特別是美國阿拉斯加北坡、加拿大本土和俄羅斯遠東地區。
Tundra greening continues to increase in the Arctic, particularly on the North Slope of Alaska, mainland Canada, and the Russian Far East.
估計整個北極地區的永久凍土每年將釋放出300-600億噸的碳到大氣中。
Thawing permafrost throughout the Arctic could be releasing an estimated 300-600 million tons of net carbon per year to the atmosphere.
自1979年開始進行衛星觀測以來,北極海冰面積在2019年夏末與2007年和2016年並列史上第二低。海冰的厚度也有所減少,導致冰蓋更容易受到變暖的空氣與海洋溫度的影響。
Arctic sea ice extent at the end of summer 2019 was tied with 2007 and 2016 as the second lowest since satellite observations began in 1979. The thickness of the sea ice has also decreased, resulting in an ice cover that is more vulnerable to warming air and ocean temperatures.
2019年8月的海面平均溫度比1982-2010年8月波弗特海、楚科奇海、拉普捷夫海和巴芬灣的平均溫度高1至7°C。
August mean sea surface temperatures in 2019 were 1-7°C warmer than the 1982-2010 August mean in the Beaufort and Chukchi Seas, the Laptev Sea, and Baffin Bay.
衛星估計顯示,北極地區的「海洋初級生產力」高於九個區域中的七個區域長期平均水平,巴倫支海和北大西洋是僅有的低於平均水平的區域。
Satellite estimates showed ocean primary productivity in the Arctic was higher than the long-term average for seven of nine regions, with the Barents Sea and North Atlantic the only regions showing lower than average values.
野生動物種群面臨減少的壓力。 例如自1980年代以來,加拿大北極地區象牙海鷗的繁殖種群減少了70%。
Wildlife populations are showing signs of stress. For example, the breeding population of the ivory gull in the Canadian Arctic has declined by 70% since the 1980s.
2019年的冬季海冰範圍勉強超過了2018年的最小範圍(編按:2018年9月459萬平方公里),導致2019年南部大陸棚的海溫破紀錄溫暖。 白令北部陸棚的底部溫度於2018年11月首次超過4°C。
The winter sea ice extent in 2019 narrowly missed surpassing the record low set in 2018, leading to record-breaking warm ocean temperatures in 2019 on the southern shelf. Bottom temperatures on the northern Bering shelf exceeded 4°C for the first time in November 2018.
從白令海和巴倫支海的漁業可以看到亞北極和北極魚類物種的分布已經北移,這與海冰的消融和底水溫度的變化有關。
Bering and Barents Seas fisheries have experienced a northerly shift in the distribution of subarctic and Arctic fish species, linked to the loss of sea ice and changes in bottom water temperature.
來自白令海社區的原住民長者指出:「由於北極變暖,人們獲取維生食物的機會正在減少,越來越難以狩獵和捕魚。與此同時,凍土的融化以及更頻繁、更強烈的暴潮正日益威脅著我們的家園、學校、機場和公用設施。」
Indigenous Elders from Bering Sea communities note that “[i]n a warming Arctic, access to our subsistence foods is shrinking and becoming more hazardous to hunt and fish. At the same time, thawing permafrost and more frequent and higher storm surges increasingly threaten our homes, schools, airports, and utilities.”
下表顯示1900-2019年相對於1981-2010,北緯60-90度地表年均溫(藍線)與全球地表年均溫(紅線)之比較,可以看出藍線(北極地區)在近幾年都高於紅線(全球),表示北極升溫嚴重。
 藍色區塊是剛生成與不到一年的冰,淺藍區塊是1-2年的冰,淺綠區塊是2-3年的冰,橘色區塊是3-4年的冰,紅色區塊是4年以上的冰。左欄數字是冰域分布百分比,底欄數字是西元年代。此圖可以看出北極海冰的「年齡」愈來愈年輕,超過4年的老冰(厚且不易消融的冰)所剩無幾,而年輕的冰(輕薄而且易融)則愈來愈多,如此下去,北極夏天很快就會完全沒冰了。 取自:https://arctic.noaa.gov/Report-Card/Report-Card-2019/ArtMID/7916/ArticleID/841/Sea-Ice
 北極海冰面積在2019年夏末(9月18日的415萬平方公里)與2007年和2016年並列史上第二低。 2019 Arctic sea ice extent ties for second-lowest summer minimum on record。The sea ice cover reached a minimum summer extent of 4.15 million km2 on 18 September 2019. This was tied with 2007 and 2016 as the 2nd lowest extent of the satellite record. 取自:NOAA Climate.gov
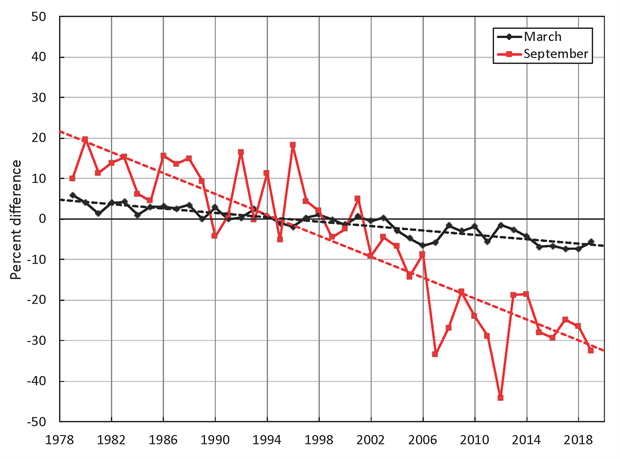 相對於1981-2010年的平均水平,整個北冰洋地區9月的月平均趨勢(也就是冰域面積減少的斜率)現在為每十年-12.9±2.2%。黑線是每年3月冰域最廣期,紅線是每年9月冰域最小期。 The September monthly average trend for the entire Arctic Ocean is now -12.9 ± 2.2% per decade relative to the 1981-2010 average 取自:https://arctic.noaa.gov/Report-Card/Report-Card-2019/ArtMID/7916/ArticleID/841/Sea-Ice
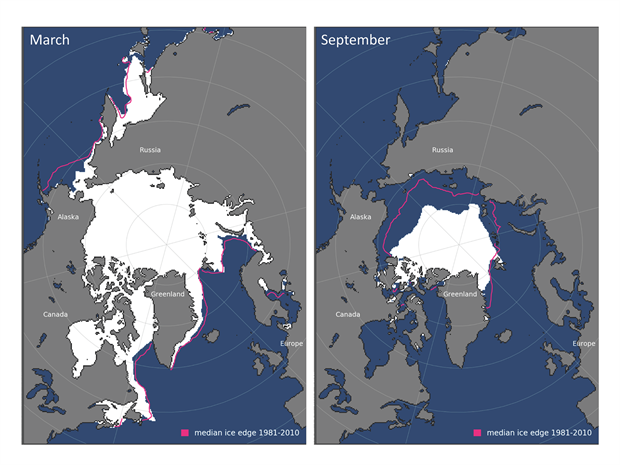 2019年3月(左)和2019年9月(右)的平均海冰範圍(白色區塊)分別呈現冬季的最大和夏季的最小範圍。洋紅色線表示1981-2010年3月和9月的冰域平均範圍。 2019年9月18日,夏季海冰覆蓋最小範圍是415萬平方公里,與2007年和2016年並列史上第二低範圍,比1981-2010年的平均最小冰域範圍少了204萬平方公里(33%)。 Average monthly sea ice extent in March 2019 (left) and September 2019 (right) illustrate the respective winter maximum and summer minimum extents. The magenta line indicates the median ice extents in March and September, respectively, during the period 1981-2010. The sea ice cover reached a minimum summer extent of 4.15 million km2 on 18 September 2019. This was tied with 2007 and 2016 as the 2nd lowest extent of the satellite record and was 2.04 million km2 (33%) less than the 1981-2010 average minimum ice extent. 取自:https://arctic.noaa.gov/Report-Card/Report-Card-2019/ArtMID/7916/ArticleID/841/Sea-Ice
| RANK 排行 | YEAR 年度 | MINIMUM ICE EXTENT 最小範圍 | DATE 記錄日期 | |
|---|---|---|---|---|
| IN MILLIONS OF SQUARE KILOMETERS
百萬平方公里 |
IN MILLIONS OF SQUARE MILES
百萬平方英里 |
|||
| 1 | 2012 | 3.39 | 1.31 | Sept. 17 |
| 2 | 2019 2007 2016 |
4.15 4.16 4.17 |
1.60 1.61 1.61 |
Sept. 18 Sept. 18 Sept. 10 |
| 5 | 2011 | 4.34 | 1.68 | Sept. 11 |
| 6 | 2015 | 4.43 | 1.71 | Sept. 9 |
| 7 | 2008 2010 |
4.59 4.62 |
1.77 1.78 |
Sept. 19 Sept. 21 |
| 9 | 2018 2017 |
4.66 4.67 |
1.80 1.80 |
Sept. 23 Sept. 13 |
| 11 | 2014 2013 |
5.03 5.05 |
1.94 1.95 |
Sept. 17 Sept. 13 |
| 13 | 2009 | 5.12 | 1.98 | Sept. 13 |
Values within 40,000 square kilometers (15,000 square miles) are considered tied. The 2018 value has changed from 4.59 to 4.66 million square kilometers (1.80 million square miles) when final analysis data updated near-real time data, dropping 2018 to a tied ninth position with 2017. Credit: NSIDC
延伸閱讀:
Global Climate Report – Annual 2019
NASA, NOAA Analyses Reveal 2019 Second Warmest Year on Record
Annual Global Analysis for 2019
NSIDC:2019 Arctic sea ice reaches second lowest minimum in satellite record
CNN: Australia’s deadly wildfires are showing no signs of stopping. Here’s what you need to know
2019–20 Australian bushfire season
2020年氣候統計及30秒看地球141年逐漸發燒狀況(影片、圖片、數據)
2020至2024年這五年中,地球將可能再創高溫紀錄(中英對照)
2015-2018史上最熱4年,一分鐘看地球139年逐漸發燒狀況(中英對照)
北極冰況消融危機持續惡化-2018北極報告摘要(影片、相片、數據)-中英對照


這問影響層面很廣
就繼續吧!地球有機會擺脫癌細胞