2024年1月上旬,許多科研機構陸續提出氣候監測分析報告,都確認2023年是氣象史上最熱的一年,多項數據打破紀錄。全球各地記錄了極端高溫、強降雨、洪水和迅速增強的熱帶氣旋等大量極端氣候事件。我將一些目前披露的氣候監測資料彙整在此,讓大家一併了解我們的生存環境正面臨極大的氣候風險,對生活、生產與生態都產生重大影響,而這影響是有遞延效應,還將持續擴大與惡化中。
為了方便了解原始文件所述,重點部分我會採雙語對照;圖片則以中文註解在圖內或下方圖說。您可擷取內文與圖片(須註明原始來源)作為環境教育素材。
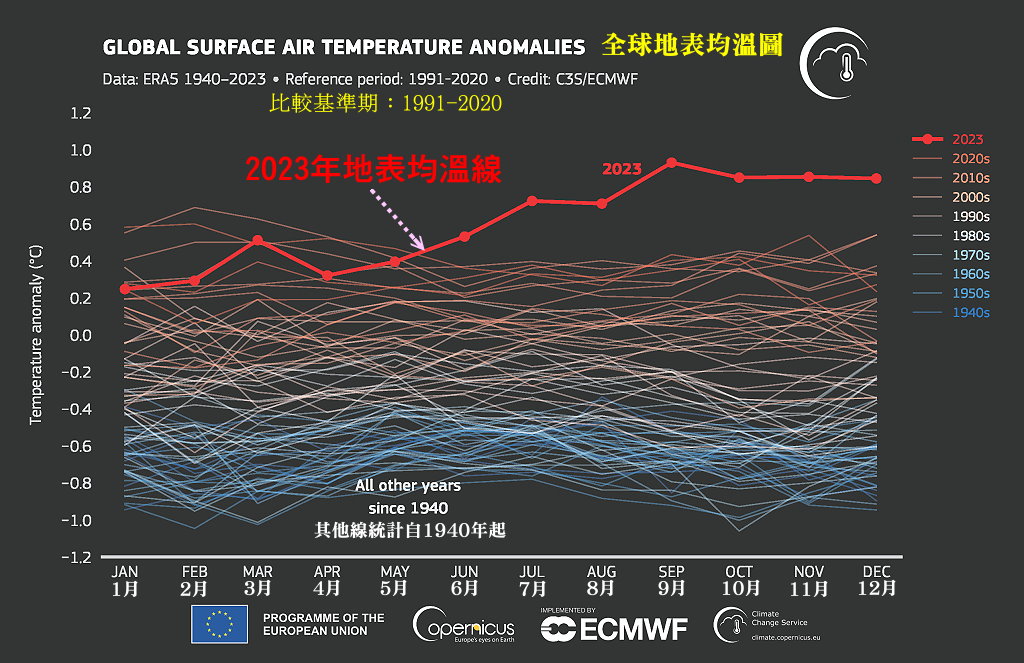
歐洲氣候監測機構「哥白尼氣候變化服務」(Copernicus Climate Change Service)提出2023年氣候概覽(Global Climate Highlights 2023),指2023年是有紀錄以來最熱的一年,並接近升溫1.5°C大限(2023 is the hottest year on record, with global temperatures close to the 1.5°C limit)。英國氣象局(Met Office)也提出一樣結論(2023: The warmest year on record globally)。氣候變遷加劇了全球的熱浪、乾旱和野火,並將全球平均氣溫推向比工業革命前基準高出1.48°C,快要超過 2015 年巴黎協議訂下的 1.5°C 目標。
全球暖化加劇的主要原因是人類為生活與生產,持續創紀錄的排放二氧化碳、甲烷等溫室氣體。

- 2023 年為自 1850 年以來全球溫度資料紀錄中最熱的一年。
- 2023 年全球平均氣溫為 14.98℃,較前次最高值 2016 年上升0.17℃
- 2023 年比 1991-2020 年平均氣溫高 0.60°C,比 1850-1900 年工業化前高 1.48°C
- 截至 2024 年 1 月或 2 月的 12 個月期間,氣溫可能比工業化前水準高出 1.5°C 以上
- 2023 年標誌著有紀錄以來首次一年內每天氣溫比 1850-1900 年工業化前水準高出 1°C。 近 50% 的日子比 1850-1900 年的水平高出 1.5°C 以上,11 月的兩天首次出現高出 2°C 以上的情況。
- 除澳洲外,所有海盆和所有大陸的大部分地區的年平均氣溫是有史以來最溫暖的,或接近最溫暖的。
- 2023 年 6 月至 12 月的每個月都比往年相應月份溫暖。
- 2023 年 7 月和 8 月是有紀錄以來最熱的兩個月。 北方夏季(六月至八月)也是有紀錄以來最溫暖的季節。
- 2023年12月是全球有紀錄以來最熱的12月,平均氣溫為13.51℃,比1991-2020年平均氣溫高0.85℃,比1850-1900年平均氣溫高1.78℃。
Global surface air temperature highlights:
- 2023 is confirmed as the warmest calendar year in global temperature data records going back to 1850
- 2023 had a global average temperature of 14.98°C, 0.17°C higher than the previous highest annual value in 20162023 was 0.60°C warmer than the 1991-2020 average and 1.48°C warmer than the 1850-1900 pre-industrial level
- It is likely that a 12-month period ending in January or February 2024 will exceed 1.5°C above the pre-industrial level
- 2023 marks the first time on record that every day within a year has exceeded 1°C above the 1850-1900 pre-industrial level. Close to 50% of days were more than 1.5°C warmer then the 1850-1900 level, and two days in November were, for the first time, more than 2°C warmer.
- Annual average air temperatures were the warmest on record, or close to the warmest, over sizeable parts of all ocean basins and all continents except Australia
- Each month from June to December in 2023 was warmer than the corresponding month in any previous year
- July and August 2023 were the warmest two months on record. Boreal summer (June-August) was also the warmest season on record
- December 2023 was the warmest December on record globally, with an average temperature of 13.51°C, 0.85°C above the 1991-2020 average and 1.78°C above the 1850-1900 level for the month. You can access information specific for December 2023 in our monthly bulletin

和甲烷(右)的平均濃度。圖片來源:C3S-CAMS-ECMWF-不來梅(Bremen)大學-SRON.jpg)


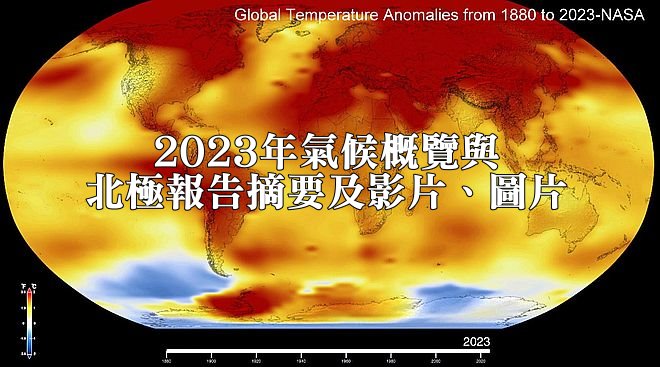
以下是美國航空暨太空總署(NASA)製作的影片,呈現1880年至2023年共144年來全球夏天氣溫相對於1951年至1981年夏天平均溫度比較之變化,2023年測得有史以來最熱夏天,地球大半片通紅。
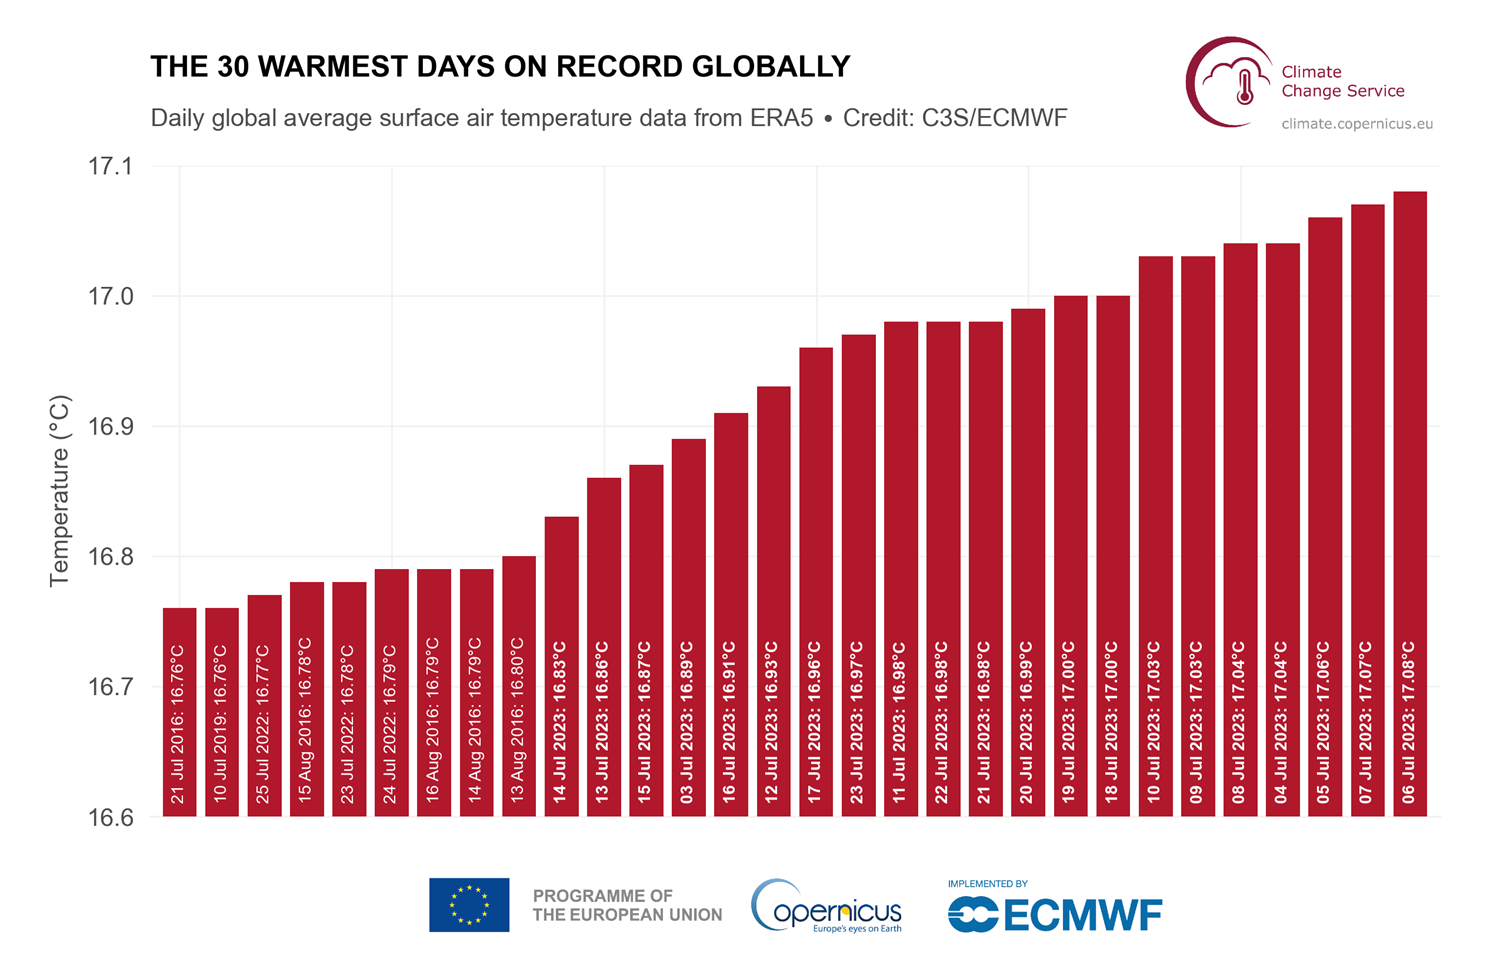
世界氣象組織(World Meteorological Organization, WMO)也宣布2023年7月6日測得有史以來全球單日最高均溫17.08°C,而目前排行前30名的全球單日最高均溫紀錄,2023年7月就佔了21天。(下圖)
NASA另外有一部影片,呈現格陵蘭島冰原範圍從2002年至2023年一路縮減的情形,左圖以區域顏色變化(淺黃-黃-橘-紅-暗紅)顯示冰的流失量愈來愈大),右圖以曲線圖搭配年度與月份跟左圖變化時空呼應。
世界氣象組織也發布新聞(WMO confirms that 2023 smashes global temperature record)確認2023年是有紀錄以來最熱一年,指去年全球平均氣溫升幅極大,7月和8月是有史以來最熱的兩個月。世界氣象組織表示,自20世紀80年代以來,每個十年的氣溫都高於前一個十年。2023年,全球各地記錄了極端高溫、強降雨、洪水和迅速增強的熱帶氣旋等大量極端氣候事件。
美國國家海洋暨大氣總署(NOAA)「2023年度全球氣候報告」也說2023 年是自 1850 年有全球紀錄以來最熱的一年,氣溫比 20 世紀百年平均氣溫 13.9°C (57.0°F) 高出 1.18°C (2.12°F)。打破原最高溫紀錄的2016年,多出0.15°C (0.27°F)。1850至2023年的174年間,全球最熱年前十名排行都在21世紀的最近十年(從2014-2023年)。 值得注意的是,2005年是21世紀第一個創下全球高溫新紀錄的一年,現在則是有紀錄以來第12個最熱年份。 2010 年紀錄超過了當時的 2005 年,現在是有史以來第 11 個最高溫年。
The year 2023 was the warmest year since global records began in 1850 at 1.18°C (2.12°F) above the 20th century average of 13.9°C (57.0°F). This value is 0.15°C (0.27°F) more than the previous record set in 2016. The 10 warmest years in the 174-year record have all occurred during the last decade (2014–2023). Of note, the year 2005, which was the first year to set a new global temperature record in the 21st century, is now the 12th-warmest year on record. The year 2010, which had surpassed 2005 at the time, now ranks as the 11th-warmest year on record.

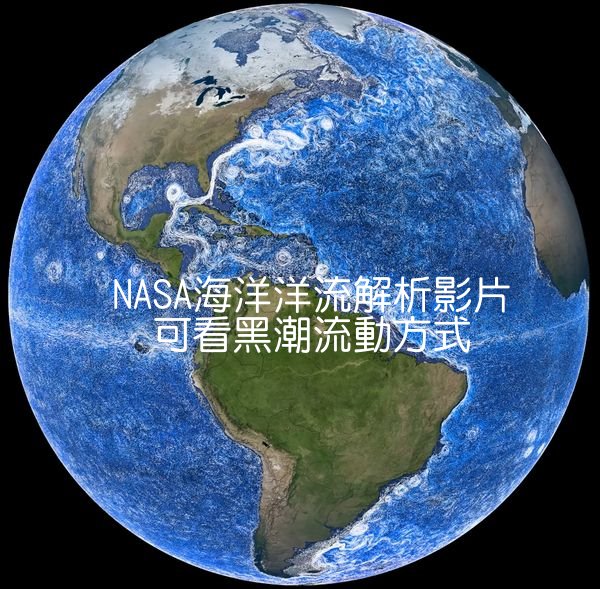
另外,由中國科學院大氣物理研究所、中國國家海洋環境預報中心、美美國國家海洋暨大氣總署等全球17個研究單位的34位科研人員組成的國際研究團隊於2024年1月發布的2023年全球海洋環境變化研究報告(New Record Ocean Temperatures and Related Climate Indicators in 2023)顯示,2023年全球年平均海面溫度、2000米深度以上海洋熱含量、海洋層結、海洋溫度的空間不均勻性都是有紀錄以來最高的一年。

基於以上認知,我們再來看2023年北極地區氣候變化的狀況。
2023年北極報告摘要

美國國家海洋暨大氣總署(National Oceanic and Atmospheric Administration, NOAA)在2023年12月發布《2023年北極報告》(Arctic Report Card 2023) ,該報告從2006年開始,每年年底發行一次,透過及時且經過同儕審查的來源,提供清晰、可靠和簡潔的有關北極環境系統各面向歷史紀錄比對的最新環境資訊。 此報告希望提供給對北極環境和科學有興趣的科學家、教師、學生、決策者和普通大眾參考。NOAA「北極報告」由13個國家的82名專家作者共同合作,現已到第18年。
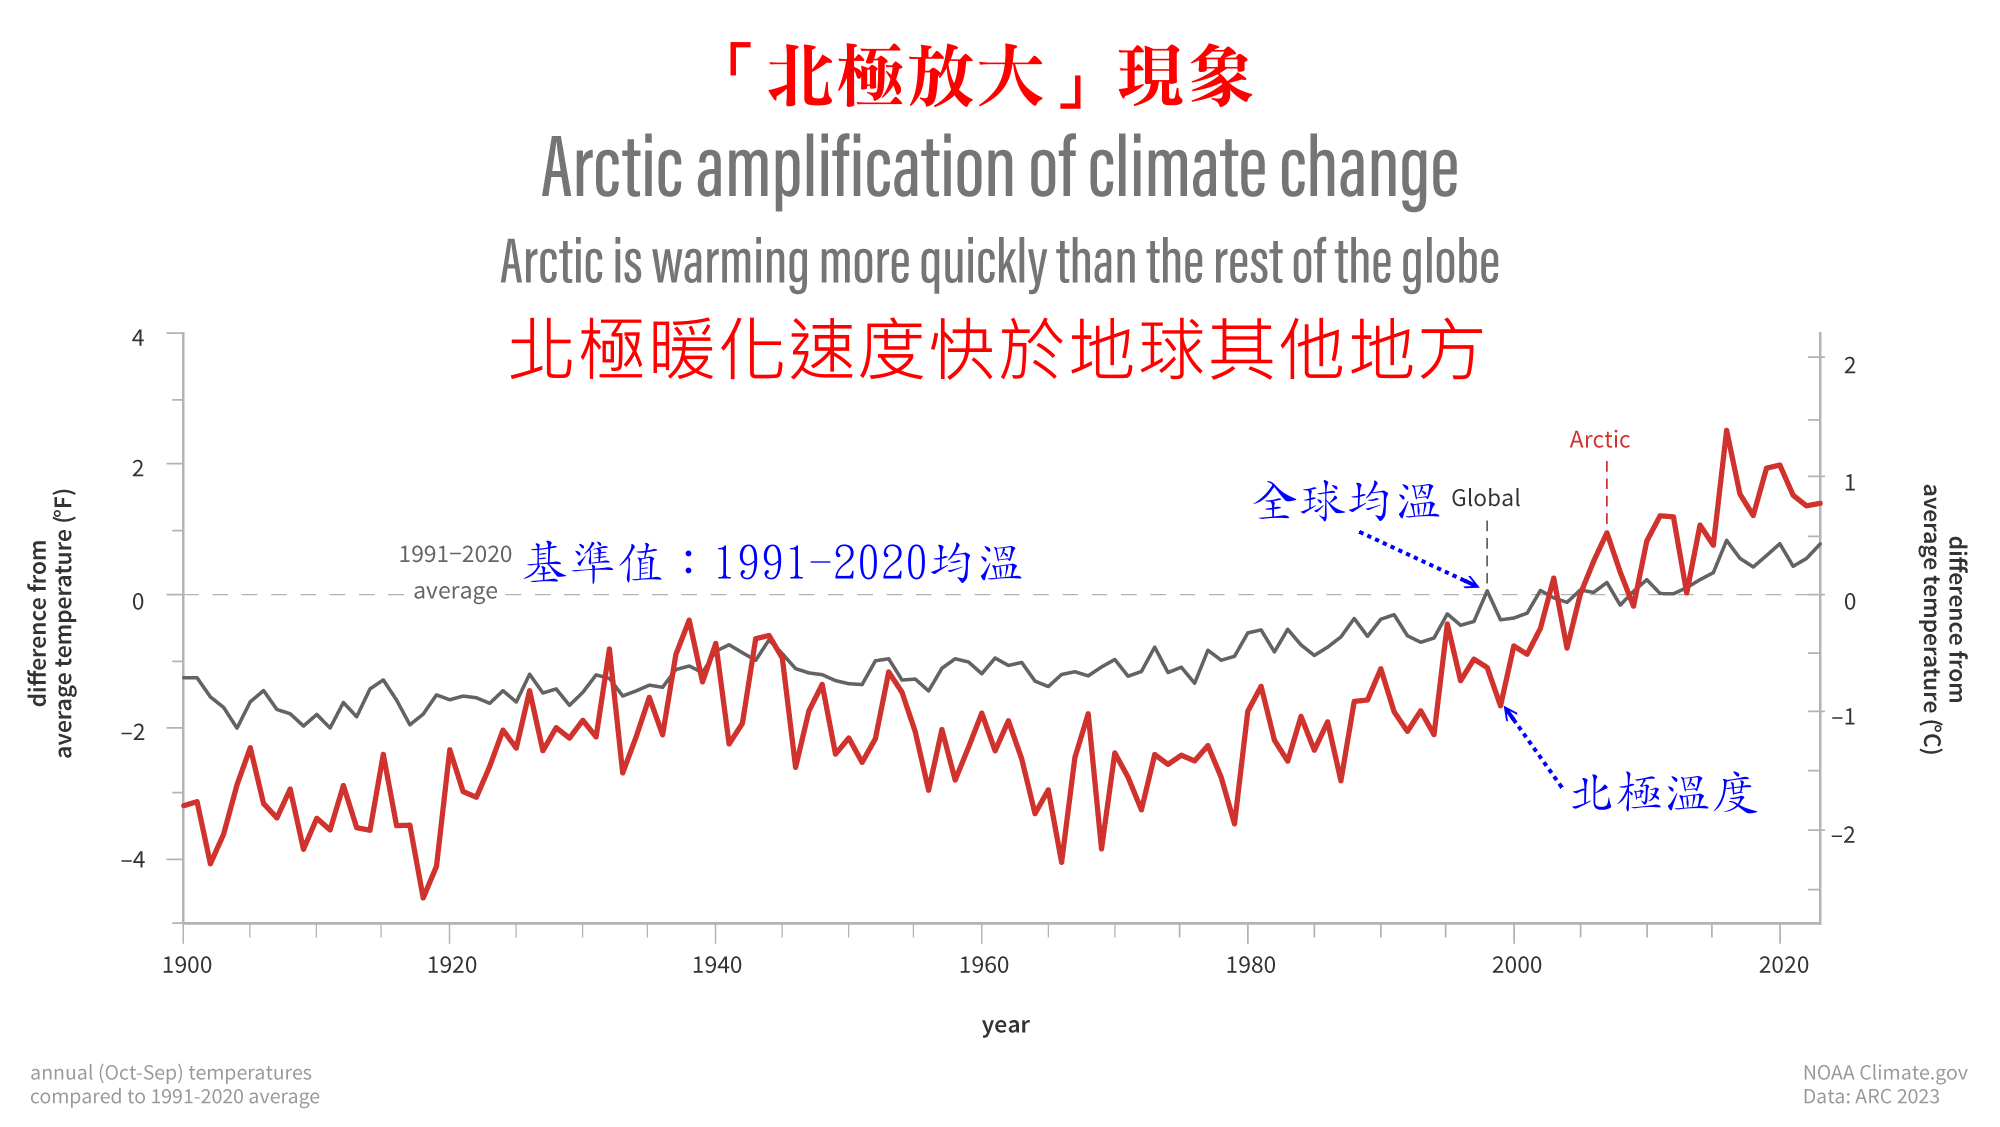
2023年的年度氣候監測報告強調北極持續暖化,包括海洋與氣溫變暖、積雪減少、海冰縮小,以及格陵蘭島冰原(Greenland Ice Sheet)繼續融化。
《2023年北極報告》影片。 影片內容 Video content:
00:00 – 介紹 Intro
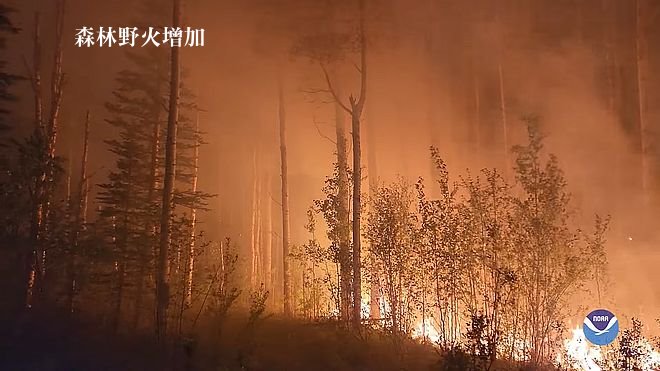
00:05 – 極端氣候 Extreme weather
00:18 – 北極氣候變化動畫 Arctic animation
00:42 – 格陵蘭冰原融冰 Greenland Ice Sheet
00:47 – 苔原綠化 Tundra greening
01:05 – 加拿大野火 Wildfire in Canada
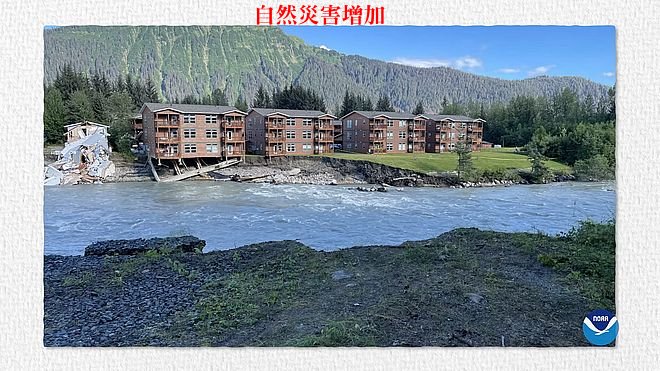
01:16 – 極地社區與原住民生活遭受氣候變化影響 Arctic communities and Indigenous peoples
01:44 – 西阿拉斯加鮭魚生態變化 Western Alaska salmon
02:21 – 芬蘭泥炭地復原 Finland peatlands restoration
03:11 – 工作群名單 Credits
底下貼幾張影片中的影像,內有簡單說明文字。


北極雖離我們很遠,但它環境的點滴變化都會如「蝴蝶效應」般的影響到我們的現在與未來,能不關心嗎?
我翻譯北極報告摘要如下,並附上相關圖片與說明,請參考,也可作為環境教育素材:
摘要 Highlights
氣溫方面
- 2023年是北極排名第6最熱的年份。
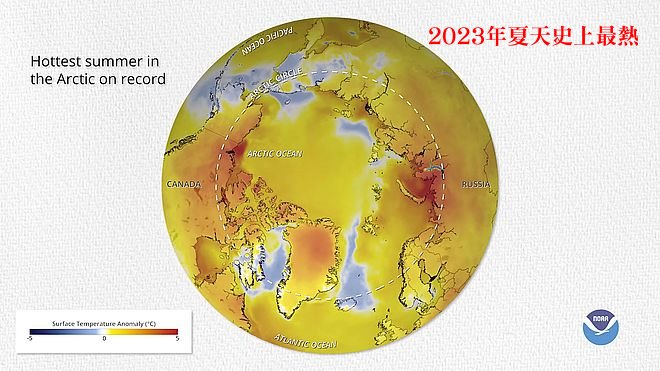
- 有紀錄以來最熱夏季。
- 夏季高壓系統為格陵蘭冰原帶來暖溫,導致廣泛的融冰與異常的降雨量。
In the air
- Average surface air temperatures for the Arctic in the past year were the sixth warmest since 1900.
- Summer surface air temperatures were the warmest on record.
- Summer high-pressure systems brought warm temperatures, widespread melting, and exceptional rainfall volumes across the Greenland Ice Sheet.
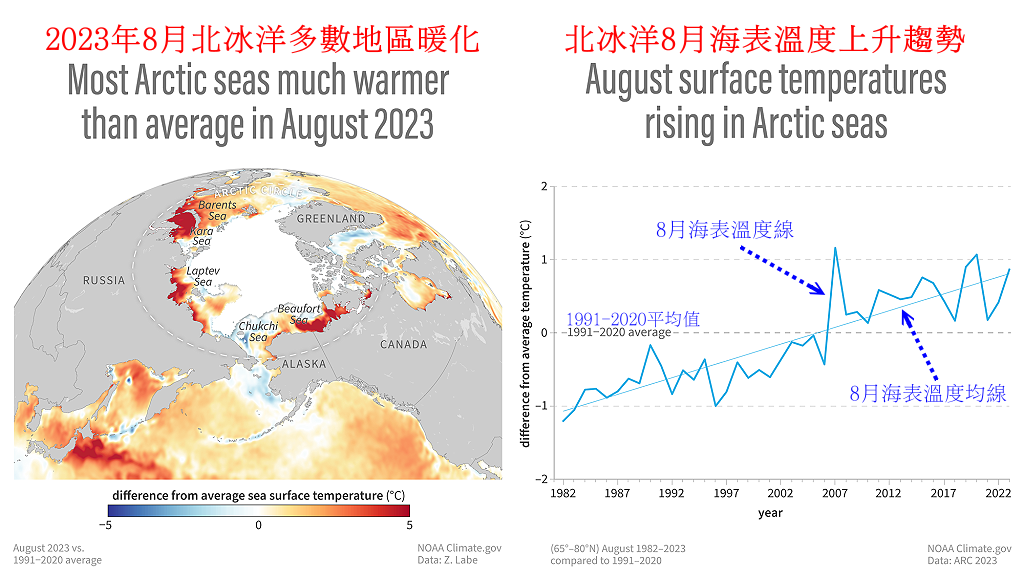
海洋方面
- 海冰範圍持續減少,2007年至2023年連續17年的9月達到有紀錄以來的最低水準。2023年海冰範圍是自 1979 年以來紀錄排名第六低。
- 8 月平均海面溫度顯示,1982-2023 年期間,幾乎所有 8 月無冰的北冰洋海面溫度都呈持續變暖趨勢。北緯 65° 至 80° 之間區域的平均海面溫度以每十年約 0.9°F (約 0.5°C) 的速度上升。
- 除楚科奇海、博福特海和加拿大群島外,北極地區海洋浮游植物(或海洋初級生產力)持續增加,其中歐亞北極和巴倫支海的變化幅度最大。
- 自末次盛冰期結束以來,海平面上升淹沒了北冰洋周圍的陸地永久凍土,導致近 100 萬平方英里(約 250 萬平方公里)的海底永久凍土面臨解凍風險。必須開展國際研究合作,以解決有關海底永久凍土範圍和現狀的關鍵問題,並估算其冰融時將釋放的溫室氣體(二氧化碳和甲烷)量。
In the ocean
- Sea ice extent continues to decline, with the last 17 September extents (2007-23) as the lowest on record. Sea ice extent was 6th lowest in the satellite record, since 1979.
- August mean sea surface temperatures show continued warming trends for 1982-2023 in almost all Arctic Ocean regions that are ice-free in August. Mean sea surface temperature over regions between 65° N and 80° N is increasing at a rate of ~0.9°F (~0.5°C) per decade.
- Arctic regions, except for the Chukchi Sea, Beaufort Sea, and Canadian Archipelago, continue to show increased ocean phytoplankton blooms, or ocean primary productivity, with the largest percent change in the Eurasian Arctic and Barents Sea.
- Since the end of the Last Glacial Maximum, rising sea levels have inundated terrestrial permafrost surrounding the Arctic Ocean, resulting in nearly 1 million square miles (~2.5 million square km) of subsea permafrost that is at risk of thawing. International research collaboration is needed to address critical questions regarding the extent and current state of subsea permafrost and to estimate the potential release of greenhouse gasses (carbon dioxide and methane) as it thaws.
陸地方面
- 2023 年 5 月,北美積雪範圍創歷史新低,而 2022/23 年冬季北美和歐亞大陸的積雪範圍均高於平均水準。
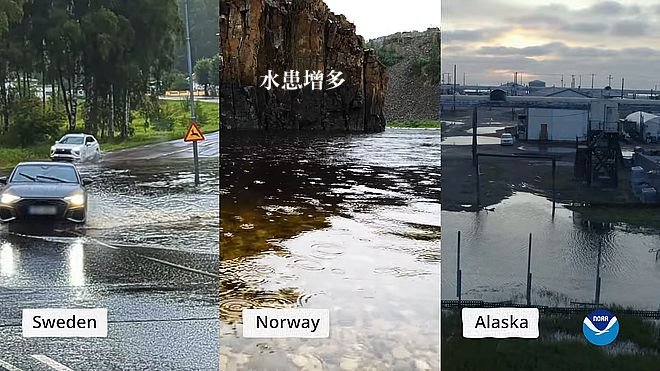
- 北極各地的強降水事件一再打破紀錄,2022-23 年泛北極降水量是歷史第六高。
- 2023 年 6 月 26 日,格陵蘭島「峰頂觀測站」測得 32.7°F(0.4°C)氣溫,並出現設站 34 年來的第五次融冰現象(即有觀測紀錄以來第五次測得零度以上氣溫)。
- 格陵蘭冰原繼續出現冰量流失, 在2022年9月1日至2023年8月31日, 冰原總質量減少約350兆磅(1560億公噸)。
- 2023年環極地平均苔原綠度峰值(即透過衛星測量的整個植被,包括覆蓋草原和苔原的植物、灌木和樹木),是24年紀錄第三高。
- 在芬蘭,泥炭地復原和野化展示了碳匯是對全球有益的氣候解決方案,並有必要推廣到受影響地區。重新野化需要夥伴關係、承認原住民和社區的權利,以及利用原住民知識和科學來取得成功並避免重複過去的不公平現象。(編按:野化(Wilding )是規劃人類與大自然關係前進的道路。 從根本上來說,野化是一種「不干涉」的生態復原方法。 不僅只追求穩定、持久的保護特定棲地並努力維持特定的物種組成,而是更在意促進自然化的進程和生態功能,以造福生物多樣性和社會。)
On the land
- North American snow cover extent set a record low in May 2023, while snow accumulation during the 2022/23 winter was above average across both North America and Eurasia.
- Heavy precipitation events broke existing records at various locations across the Arctic and the Pan-Arctic precipitation for 2022-23 was the sixth highest on record.
- On 26 June 2023, Summit Station, Greenland reached 32.7°F (0.4°C) and experienced melt for only the fifth time in its 34-year observational history.
- The Greenland Ice Sheet lost roughly 350 trillion pounds (156 ± 22 Gt) of mass from 1 September 2022 to 31 August 2023 because discharge and melting exceeded accumulation.
- The 2023 circumpolar average peak tundra greenness, which is the overall vegetation, including plants, shrubs, and trees taking over grassland and tundra, as measured by satellite, was the third highest in the 24-year record.
- In Finland, peatland restoration and rewilding demonstrate a globally relevant climate solution of carbon sinks and point to a need for replication across impacted sites. Rewilding requires partnership, recognition of Indigenous and community rights, and the use of Indigenous knowledge alongside science to succeed and avoid replication of past inequities.
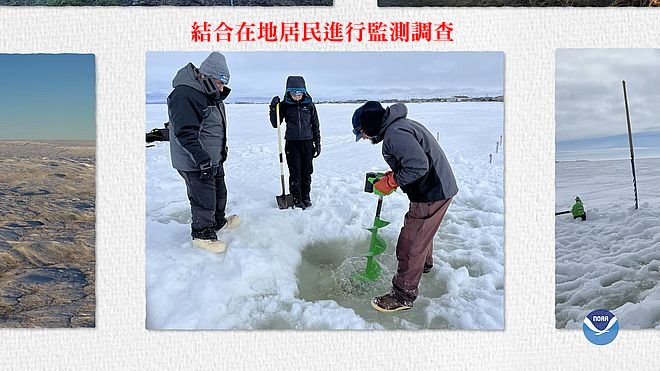
努納阿基特-薩瓦卡提格魯吉奇(Nunaaqqit Savaqatigivlugich): 與社區合作觀測北極
- 阿拉斯加北極觀測站和知識中心(AAOKH)與沿海原住民觀察員網絡合作,對阿拉斯加北部的環境變化和影響進行長期、全面的觀察記錄。
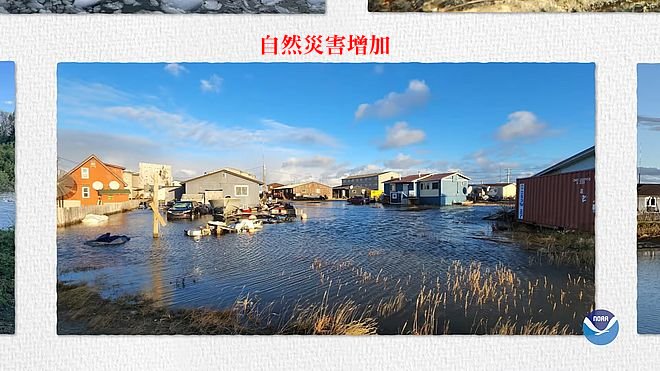
- 最近,原住民觀察員注意到海冰消失、氣溫和海溫都升高、風型改變以及會造成洪水和侵蝕的沿海風暴強度與頻率都增加。
- 原住民觀察員還記錄了環境變化對社區和文化基礎設施、傳統收穫和活動以及陸地和海洋旅行安全等在地的影響。
- 在決策過程中應以原住民的觀點和對北極變化的觀察為核心,以促成更具包容性、更公平和由社區主導的應對措施。
Nunaaqqit Savaqatigivlugich: Working with communities to observe the Arctic
- The Alaska Arctic Observatory and Knowledge Hub (AAOKH) works with a network of coastal Indigenous observers to document long-term and holistic observations of environmental change and impacts in northern Alaska.
- Recently, Indigenous observers have noted sea ice loss, warmer air and ocean temperatures, changing wind patterns, and increased intensity and frequency of coastal storms that contribute to flooding and erosion.
- Indigenous observers also document local-scale impacts of environmental changes to community and cultural infrastructure, traditional harvests and activities, and travel safety across the land and sea.
- Applying and centering Indigenous perspectives and observations of Arctic change in decision-making can lead to more inclusive, equitable, and community-led responses.
阿拉斯加西部的鮭魚對氣候變遷的不同反應
- 2021-22 年期間,阿拉斯加西部的鮭魚數量呈現極端狀況,帝王鮭和白鮭的數量創歷史新低(分別比 30 年平均值少 81% 和 92%),而紅鮭的數量則創歷史新高(比 30 年平均值多 98%)。
- 成年鮭魚的體型愈來愈小。自 20 世紀 70 年代以來,育空河帝王鮭的平均成年體長估計減少了 6%,繁殖力(即繁殖後代的能力)估計減少了 15%,這很可能加劇了種群數量的減少。
- 鮭魚數量的減少導致了漁業的蕭條,加劇了業者衝突,並對與鮭魚有著千年聯繫的原住民社區的文化和食品安全產生了深遠的影響。
- 鮭魚數量和大小的變化與淡水和海洋生態系統的氣候變化以及海洋生態競爭有關。捕食者、食物供應和疾病的變化也可能是重要的因素。
Divergent responses of western Alaska salmon to a changing climate
- Western Alaska salmon abundance reached historic extremes during 2021-22, with record lows for Chinook and chum salmon (81% and 92% below the 30-year mean, respectively) and record highs for sockeye salmon (98% above the 30-year mean).
- Salmon are maturing at smaller sizes. Since the 1970s, Yukon River Chinook salmon have decreased an estimated 6% in mean adult body length and 15% in fecundity, or ability to produce offspring, likely exacerbating population declines.
- Salmon population declines have led to fishery closures, worsened user conflicts, and had profound cultural and food security impacts in Indigenous communities that have been tied to salmon for millennia.
- Changes in salmon abundance and size are associated with climatic changes in freshwater and marine ecosystems and competition in the ocean. Changes in predators, food supply, and disease are also likely important drivers.
底下是該報告相關圖表(來源:《2023年北極報告》文件及影片),請參考說明:


海冰範圍是歷年倒數第六,而長期也呈現持續縮小的趨勢-1.png)
氣候變遷是正在進行式,而且惡變速度愈來愈快,聯合國秘書長古特雷斯(António Guterres)說「人類已經打開了地獄之門。」,強調氣候行動跟所面臨的挑戰相比,明顯不足,如果再不做出改變,大家會走向危險和不穩定的世界。
為了您及子孫的長遠幸福生活,您個人、家庭與職場是否都無時無刻不實踐環保作為?
《2023年北極報告》可全文下載PDF檔:https://arctic.noaa.gov/wp-content/uploads/2023/12/ArcticReportCard_full_report2023.pdf
北極報告圖片與說明(英文):2023 Arctic Report Card: image highlights
延伸閱讀:
世界氣象組織《2024年全球氣候報告》摘要-可當環境教育素材
氣候變遷效應:2023年是氣候新紀錄年(中英對照、有報告可下載)
2020至2024年這五年中,地球將可能再創高溫紀錄(中英對照)
2019年氣候統計及30秒看地球140年逐漸發燒狀況(影片、圖片、數據)
北極冰況消融危機持續惡化-2018北極報告摘要(影片、相片、數據)-中英對照
Alaska salmon woes, extreme precipitation, tundra shrub growth part of Arctic transformation
Earth boiled in 2023 — will it happen again in 2024?