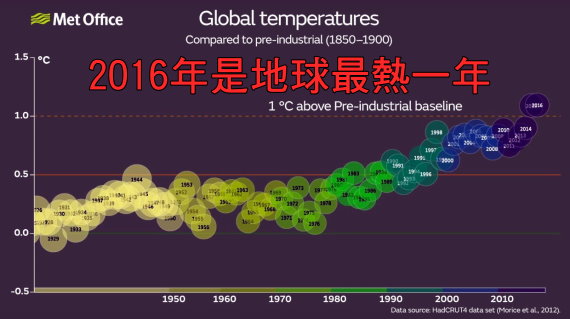
英國氣象局(Met Office)於2017年1月18日發布新聞,再次確認「2016年是地球有史以來最熱一年」(2016: one of the warmest two years on record)。
該新聞說從目前獲得的2016年地表全年均溫統計,打破2015年紀錄,成為有氣象史以來最熱的一年。
從1850年開始有地球氣象紀錄,2015與2016年是溫度最高的二年,而2016年均溫略高於2015年。
2016年地表均溫高於1961-1990的長期均溫約0.77±0.1 °C,2015年則是高出0.76±0.1 °C。如果2016均溫與1850-1900工業化前的長期均溫比較,則高出1.1 °C。
2016年會特別熱是因為聖嬰年關係,大概增加了0.2°C。
地球會持續發燒,主要是因為人類在過去150年間排放大量溫室氣體到大氣層所致。
底下是英國氣象局製作的一段影片,呈現地球從1850年到2016年每年地球均溫上下變化的情形,可以看到從1980年代開始,地球就明顯發燒,而從21世紀開始則有攀升趨勢,居高不下。
Credit: Met Office
Provisional full-year figures for global average near-surface temperatures confirm that last year, 2016, was one of the warmest two years on record, nominally exceeding the record temperature of 2015.
When viewed alongside 2015, the two years are the warmest in an annual series of figures that starts in 1850.
Scientists at the Met Office Hadley Centre and the University of East Anglia’s Climatic Research Unit produce the HadCRUT4 dataset, which is used to estimate global temperature. The global temperature series shows that 2016 was 0.77±0.1 °C above the long-term (1961-1990) average, nominally a record since at least 1850. When compared with the 1850 to 1900 baseline – which is indicative of pre-industrial temperatures – the 2016 average global temperature anomaly was around 1.1 °C (see below). For comparison, 2015 was 0.76±0.1 °C above the long-term (1961-1990) average.
A particularly strong El Niño event contributed about 0.2°C to the annual average for 2016, which was about 1.1C above the long term average from 1850 to 1900. However, the main contributor to warming over the last 150 years is human influence on climate from increasing greenhouse gases in the atmosphere.
下表顯示從2000年至2016年各年地表均溫跟1961至1990長期均溫比較之溫差
|
Year 年度 |
Anomaly 溫差 |
95% confidence range 95%信心區間 |
|
(°C relative to 1961-1990) 相較1961-1990地表均溫攝氏度 |
(°C relative to 1961-1990) 相較1961-1990地表均溫攝氏度 |
|
|
2016 |
0.77 |
[0.69 to 0.87] |
|
2015 |
0.76 |
[0.67 to 0.85] |
|
2014 |
0.58 |
[0.49 to 0.67] |
|
2013 |
0.51 |
[0.42 to 0.60] |
|
2012 |
0.47 |
[0.38 to 0.56] |
|
2011 |
0.42 |
[0.33 to 0.51] |
|
2010 |
0.56 |
[0.47 to 0.65] |
|
2009 |
0.51 |
[0.42 to 0.60] |
|
2008 |
0.39 |
[0.31 to 0.48] |
|
2007 |
0.49 |
[0.41 to 0.58] |
|
2006 |
0.51 |
[0.42 to 0.60] |
|
2005 |
0.54 |
[0.45 to 0.64] |
|
2004 |
0.45 |
[0.36 to 0.54] |
|
2003 |
0.51 |
[0.42 to 0.60] |
|
2002 |
0.50 |
[0.41 to 0.59] |
|
2001 |
0.44 |
[0.35 to 0.53] |
|
2000 |
0.29 |
[0.21 to 0.39] |
延伸閱讀:
NASA:2017年是史上第二熱 50秒看地球138年逐漸發燒狀況(影片)
北極冰融得更快了—2016年地球發燒與北極冰況總檢視(數據、圖片、影片)
本網誌「氣候變遷」專欄各文


紀錄是拿來破的
好像是這樣耶,年年高升 >\\\”<
該不會年年破紀錄,年年都是「有史以來最熱一年」吧~