地球年紀大概45.4億年,從一片混沌逐漸形成陸與海,有了大氣,有了生命,有了色彩,其間也經歷數次的板塊分分合合,以及無數次氣候的冰熱變化,但那都是起碼以千百萬年計的時程,可人類社會的工業發展及資本主義盛行後,氣候狀況卻在百餘年間有了巨變。人類活動所產生的溫室氣體排到大氣層後,形成了鍋蓋效應,讓本來可以發散到外太空的部分太陽熱能鎖在地球大氣圈內,地球像個悶燒鍋,地表溫度不再穩定,愈來愈高,也因此打破氣候的平衡,開始有了現代最夯名詞「氣候變遷」表示的各種不利人類生存的危機現象產生。
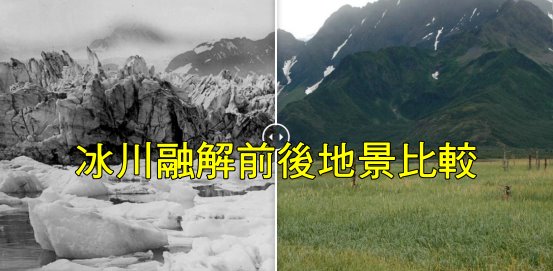
地球發燒中,最明顯的證據就是冰川的融化消解。
美國航空暨太空總署(NASA)設了一個叫作「地景變化畫廊」(Images of Change gallery)的網站,呈現經歷一段時間後,同一個地點在景觀上的變化,內容涵蓋冰川消退、洪水氾濫、湖泊乾涸、海岸變遷、土地都市化、森林野火等,從這些影像可以讓我們看到無論是自然因素或人為因素,都在時間的遞嬗中改變了地貌,更牽動了地球上所有生命的命運。
Images of Change gallery features images of different locations on planet Earth, showing change over time periods ranging from centuries to days. Some of these effects are related to climate change, some are not. Some document the effects of urbanization, or the ravage of natural hazards such as fires and floods. All show our planet in a state of flux.
我將該網站比較冰川消退前後的影像貼在底下,並簡單翻譯說明,讓大家看一下人類自己造成的地球暖化確實帶來短時間(相對地質年代)莫大的破壞力,已經對我們的世界造成重大改變,只是這些改變遠在天邊,甚至不是有生之年可以察覺的,但藉著科學家的努力蒐集,有了這麼多的見證,我們還能忽視地球快速升溫的事實,還能繼續無感的揮霍資源、製造溫室氣體嗎?
 Credit: NASA
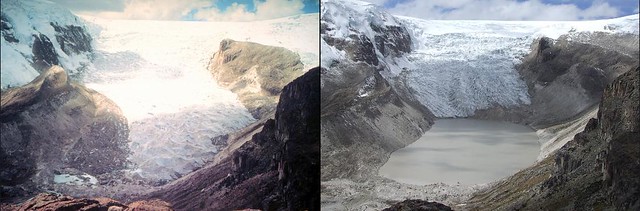
位於秘魯安第斯山脈,海拔5691公尺的庫里卡里斯冰川(Qori Kalis Glacier),是全球熱帶地區最大的注出冰川(outlet glacier,從冰原或冰帽流出但被侷限在露出的床岩間)。1978年的照片(左圖)顯示,冰川還在向前延伸,在2011年(右圖),冰川卻已完全退回到陸地,留下約86公頃、約60米深的湖泊。
Melting Qori Kalis glacier, Peru
July 1978 – July 2011
Qori Kalis is the largest outlet glacier of the world’s largest tropical ice cap, the Quelccaya Ice Cap, which lies on a plateau 18,670 feet (5,691 meters) high in the Andes mountains of south central Peru. In 1978, the glacier was still advancing. By 2011, the glacier had retreated completely back on the land, leaving a lake some 86 acres in area and about 200 feet (60 meters) deep.
Source: Dr. Lonnie G. Thompson, Distinguished University Professor, Byrd Polar and Climate Research Center, The Ohio State University
 Credit: NASA
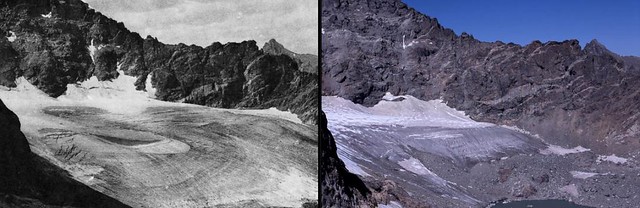
從1898年(左圖)至2003年(右圖)間,在美國科羅拉多州的阿拉帕霍冰川(Arapaho Glacier)大規模縮小。當局在1960年起開始量度冰川體積,估計冰川至今至縮減了40公尺,雖然不知道1898到1960年間縮減的程度如何,不過推估應該大於40公尺。
Arapaho Glacier melt, Colorado
1898 – 2003
Arapaho Glacier has shrunk dramatically since it was photographed in 1898. Measurements collected since 1960 suggest the glacier has thinned by at least 40 meters since then; thinning between 1898 and 1960 is unknown but is probably considerably greater than 40 meters.
1898 photo taken by R. S. Brackett, published in “Arapaho Glacier: A Sixty Year Record,” University of Colorado Studies, Series in Geology, No. 3, R. S. Waldrop (1964). 2003 photo taken by Tad Pfeffer. Images courtesy of Tad Pfeffer, Institute of Arctic and Alpine Research, University of Colorado.
 Credit: NASA
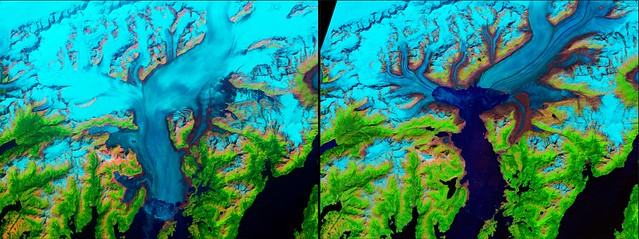
美國阿拉斯加哥倫比亞冰川從1986年(左圖)至2014年(右圖)間,沿著楚加奇山(Chugach Mountains)向威廉王子海灣(Prince Willliam Sound)退卻。1794年英國探險家記錄到該冰川的冰鼻(冰川前緣)位在哥倫比亞海灣口的希瑟島(在左圖下方邊緣中間的那個島)。冰鼻在1980年前一直維持原來位置,之後則急速消退,主因在冰川愈來愈薄,受不了潮水上下衝擊,於是快速向上游消退了12公里,要到冰床高於海平面且不再碰觸海洋,才會減緩消失速度。
Columbia Glacier melt, Alaska
July 28, 1986 – July 2, 2014
Alaska’s Columbia Glacier descends through the Chugach Mountains into Prince William Sound. When British explorers surveyed the glacier in 1794, its nose extended to the northern edge of Heather Island, near the mouth of Columbia Bay. The glacier held that position until 1980, when it began a rapid retreat. The glacier has thinned so much that the up and down motion of the tides affects its flow as much as 12 kilometers (7.5 miles) upstream, until the glacier bed rises above sea level and the ice loses contact with the ocean.
Images taken by the Thematic Mapper onboard Landsat 5 and the Operational Land Imager onboard Landsat 8. Source: NASA Earth Observatory, using data from the U.S. Geological Survey.
 Credit: NASA
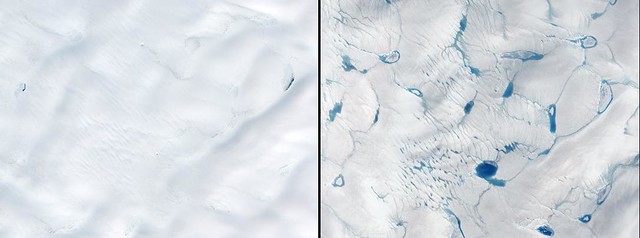
格陵蘭的冰原表面(左圖,2014年6月10日)往往在春天或早夏時會出現小溪、河流或湖泊,但2016年這樣的融化現象卻早了許多(右圖,2016年6月15日)。冰融後的水顏色較深,吸收更多的太陽熱能導致更多冰的融化。 冰水流進海洋將提升海平面,而經由裂縫流到冰河底部則會加速冰水流向海洋。
Exceptionally early ice melt, Greenland
June 10, 2014 – June 15, 2016
Meltwater streams, rivers and lakes form in the surface of the Greenland Ice Sheet every spring or early summer, but melting began exceptionally early in 2016. Melting encourages further melting when ponds of meltwater develop, since they darken the surface and absorb more sunlight than ice does. Surface melt contributes to sea-level rise when the water runs off into the ocean and when it flows through crevasses to the base of a glacier and temporarily speeds up the ice flow.
Images taken by the Advanced Land Imager onboard the Earth Observing-1 satellite and the Operational Land Imager onboard Landsat 8. Source: NASA Earth Observatory.
 Credit: NASA
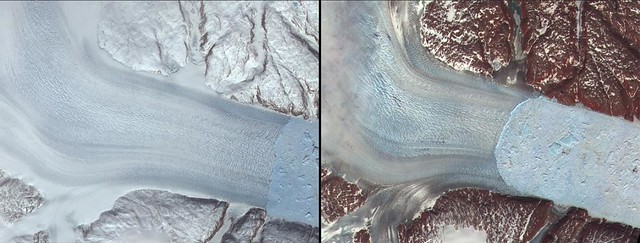
此二圖顯示位於格陵蘭冰原邊緣,經由峽灣流向海洋(圖右方向)的黑爾海姆冰川(Helheim Glacier),2001年(左圖)至2005年(右圖)間在峽灣的冰河碎成許多大大小小的冰塊。1970年代至2001年間,冰川往外推進的速度還算穩定,但在2001至2005年間,冰川卻急速消退約7.5公里,冰水流向海洋的速度正在加快。
Helheim Glacier melt, Greenland
May 12, 2001 – June 19, 2005
Along the margin of the Greenland Ice Sheet, outlet glaciers flow as icy rivers through fjords and out to sea. These pictures show a fjord in which Helheim Glacier (on the left) is crumbling into large and small icebergs (light blue, on the right). The glacier outlet (“calving front”) held steady from the 1970s until about 2001, then began to retreat towards its source about 7.5 kilometers (4.7 miles) between 2001 and 2005. The glacier’s flow to the sea has also sped up.
NASA images created by Jesse Allen, NASA Earth Observatory, using data from the Advanced Spaceborne Thermal Emission and Reflection Radiometer (ASTER) on NASA’s Terra satellite. Courtesy of NASA/GSFC/METI/ERSDAC/JAROS, and the U.S./Japan ASTER Science Team.
 Credit: NASA
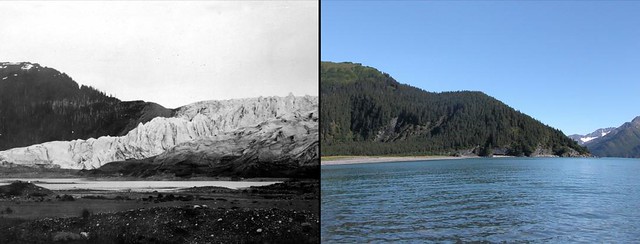
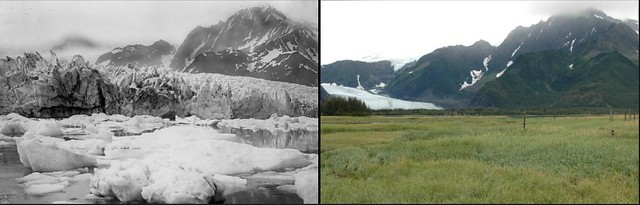
1909年7月30日的照片(左圖)拍的是麥卡蒂冰川(McCarty Glacier)尾端西側。而在2004年的影像(右圖)裏,前景中被沉積物覆蓋的冰川尾端已經往北消退15公里,以前的冰也融化為一片開放水域,而且當年不毛之地與相鄰的山坡也都成了森林。
McCarty Glacier melt, Alaska
July 30, 1909 – August 11, 2004
The 1909 photograph shows the west side of the terminus of McCarty Glacier. In the 2004 image, the terminus has retreated about 9 miles (15 kilometers) to the north. The area in the foreground, which had been covered by glacial deposits, is now open ocean water, thanks to the melting of glacier ice under the sediment deposits. The former barren zone and adjacent hillside are now covered by dense vegetation.
U.S. Geological Survey, Department of the Interior.Earlier image by W. O. Field, courtesy of the National Snow and Ice Data Center and Glacier Bay National Park and Preserve Archive. Later image is a USGS photograph by Bruce F. Molina.
 Credit: NASA
繆爾冰川( Muir Glacier)及其支流里格斯冰川(Riggs Glacier)位於阿拉斯加北端,1941年的照片(左圖)顯示兩個冰川堆疊堵塞了繆爾的入口。而到了2004年(右圖),繆爾冰川在持續退卻將近兩個世紀後已不在相片框內了,尾端縮到位於西北约7公里,而里格斯冰川則急速退卻了0.6公里。二條冰川也大大的變薄了。
Muir Glacier melt, Alaska
August 13, 1941 – August 31, 2004
The 1941 photograph shows the lower reaches of Muir Glacier and its tributary, Riggs Glacier. The two glaciers filled Muir Inlet. In the 2004 photograph, Muir Glacier, continuing a retreat nearly two centuries long, is located about 4 miles (7 kilometers) to the northwest, out of the field of view. Riggs Glacier has retreated some 0.4 miles (0.6 kilometers). Both glaciers have thinned substantially.
U.S. Geological Survey, Department of the Interior. Earlier image by W. O. Field, courtesy of the National Snow and Ice Data Center and Glacier Bay National Park and Preserve Archive. Later image is a USGS photograph by Bruce F. Molina.
 Credit: NASA
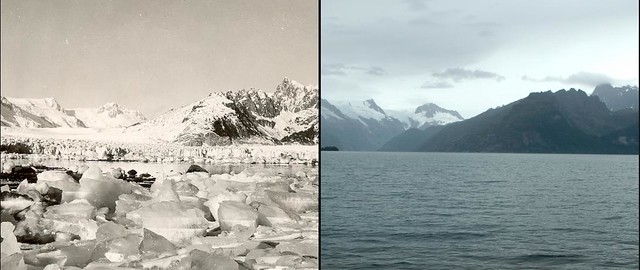
左圖是1920-1940年代從阿拉斯加肯耐峽灣國家公園哈里斯灣西岸往北望去,冰河前沿的岩岸佈滿了正在融化的西北冰川所崩解下來的小冰塊。右圖顯示大約在60至80年間,西北冰川往西北方消退了大概10公里,照片裡已看不到冰川,只剩一片汪洋。
Northwestern Glacier melt, Alaska
Winter to early summer, 1920s–1940s – August 12, 2005
Looking north from the west shoreline of Harris Bay, Kenai Fjords National Park, Kenai Mountains, Alaska. The rocky shoreline in the foreground is covered by small icebergs, calved by the retreating Northwestern Glacier. During the roughly 60 to 80 years between photographs, Northwestern Glacier retreated some 6 miles (10 kilometers) to the northwest, out of the field of view.
U.S. Geological Survey, Department of the Interior. Earlier image is from a postcard, photographer unknown, courtesy of Kenai Fjords National Park. Later image is a USGS photograph by Bruce F. Molina.
 Credit: NASA
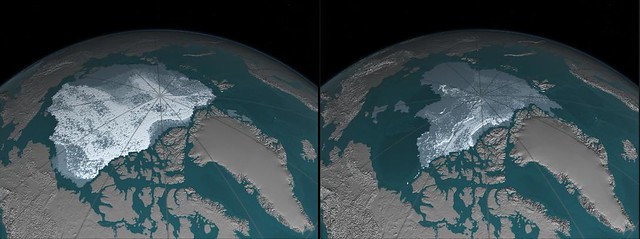
是1984年9月北冰洋4(年)齡海冰(愈白的冰)涵蓋面積達1,860,000平方公里(左圖),但到了2016年9月,則只剩下110,000平方公里(右圖)。正常的話,新形成的冰才容易消解,幾年以上的冰只有愈來愈厚且不易融化。
Older, thicker Arctic sea ice declines
September 1984 – September 2016
The area covered by Arctic sea ice at least four years old has decreased from 718,000 square miles (1,860,000 square kilometers) in September 1984 to 42,000 square miles (110,000 square kilometers) in September 2016. Ice that has built up over the years tends to be thicker and less vulnerable to melting away than newer ice.
In these visualizations of data from buoys, weather stations, satellites and computer models, the age of the ice is indicated by shades ranging from blue-gray for the youngest ice to white for the oldest. Source: NASA Earth Observatory.
 Credit: NASA
左圖是1986年智利的巴塔哥尼亞冰河狀況,右圖可以看出左邊較大冰河在2002年消退了約10公里,右邊較小的冰河則消退2公里,其前緣在崩解的殘礫中形成了二條帶狀湖泊。
Patagonia Glacier retreat, Chile
September 18, 1986 – August 5, 2002
The 1986 image shows the region prior to a major retreat of the glaciers. The 2002 image shows a retreat of nearly 10 kilometers (6.2 miles) of the glacier on the left side. The smaller glacier on the right has receded more than 2 kilometers (1.2 miles). In front of the smaller glacier, two ribbon lakes have formed behind the debris left by the glacier’s advance. Scientists and government managers are using satellite imagery like this to monitor the retreat of the glaciers and the impact on water bodies caused by the changes in the glaciers’ size and direction.
Left image taken by the Thematic Mapper sensor onboard Landsat 5. Right image taken by the Enhanced Thematic Mapper Plus sensor onboard Landsat 7. Source: USGS Landsat Missions Gallery, “Patagonia Region – Retreating Glaciers,” U.S. Department of the Interior / U.S. Geological Survey.
 Credit: NASA
1920-1940年代的照片(左圖)前景呈現鄰接愛爾利克灣(Aialik Bay)的冰川前緣瀉湖的一角,當時佩德森冰川(Pedersen Glacier)的冰塊正在崩解。2005年(右圖),瀉湖已被沉積物覆蓋,並孕育了綠草,灌木以及水生植物。圖中可看到一些直立枯木,那是1964年阿拉斯加大地震(Alaskan Earthquake)時下陷約3公尺的海岸森林遺跡。佩德森冰川的前緣退縮了2公里,林木已在濕地與冰川間生長。有幾條支流高於佩德森冰川主線,那是大概在1975年後分離的。
Pedersen Glacier melt, Alaska
Summer, mid-1920s to early 1940s – August 10, 2005
The foreground water in the earlier image is part of a lagoon, adjacent to Aialik Bay, into which Pedersen Glacier was calving icebergs. In the 2005 photograph, most of the lagoon has filled with sediment and supports grasses, shrubs and aquatic plants. The dead trees visible among the grasses are remnants of a forest that was drowned when the coast sank by some 10 feet (3 meters) during the 1964 Alaskan Earthquake. Pedersen Glacier’s terminus has retreated more than a mile (2 kilometers) and stands of trees have grown between the wetland and the glacier. The tributary high above Pedersen Glacier separated from it sometime during the third quarter of the 20th century.
U.S. Geological Survey, Department of the Interior. Earlier image is from a postcard by an unknown photographer, courtesy of Kenai Fjords National Park. Later image is a USGS photograph by Bruce F. Molina.
 Credit: NASA
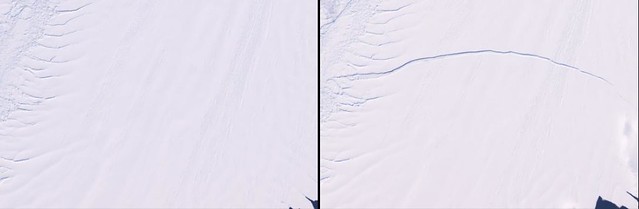
松島冰河是南極最大且移動最快的冰河之一,也比世界上其他冰河盆產生更多的海冰。而最近該冰河變薄,冰流不斷融化,因此加速產生更多的海冰。科學家擔心這樣情形會增高海平面。左圖可以看到2011年1月時冰河西緣出現一條條小裂縫,右圖則看到2012年1月已經出現一條大裂縫,而這裂縫終將切出一塊約900平方公里的大冰塊。
Pine Island Glacier calving, Antarctica
January 25, 2011 – January 28, 2012
Pine Island is one of the largest and fastest-moving glaciers in Antarctica. The Pine Island Glacier Basin contributes more ice to the sea than any other ice-drainage basin in the world, and this has increased due to recent acceleration of the ice stream caused by thinning of the glacier. Scientists are concerned about the impact Pine Island’s continued thinning will have on sea level. The 2011 image shows a series of splits along the western edge of the glacier. The same area in 2012 reveals a major break that will eventually extend all the way across the glacier and calve a giant iceberg expected to cover about 350 square miles (900 square kilometers).
Images taken by the Enhanced Thematic Mapper Plus sensor onboard Landsat 7. Source: U.S. Geological Survey (USGS) Landsat Missions Gallery, “Pine Island Glacier,” U.S. Department of the Interior / USGS.
 Credit: NASA
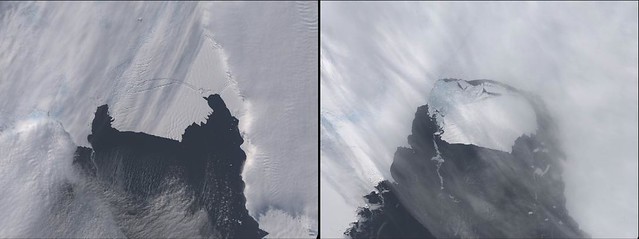
2013年11月9日至11日三天之間,南極的松島冰河裂解出一個長35公里、寬20公里的大冰塊(右圖)。這種情形大概每5、6年發生一次,但這個被稱為B-31的冰塊卻比這區域以前裂開的冰塊還大了一半。
Pine Island Glacier calving, Antarctica
October 28, 2013 – November 13, 2013
An iceberg estimated to be 35 by 20 kilometers (22 by 12 miles) separated from Antarctica’s Pine Island Glacier between November 9 and 11, 2013. Such events happen about every five or six years but this iceberg, designated “B-31,” is about 50 percent larger than its predecessors in this area. A team of scientists from Sheffield and Southampton universities will track the 700 square-kilometer chunk of ice and try to predict its path using satellite data.
Images taken by the Operational Land Imager onboard Landsat 8. Source: NASA Earth Observatory
 Credit: NASA
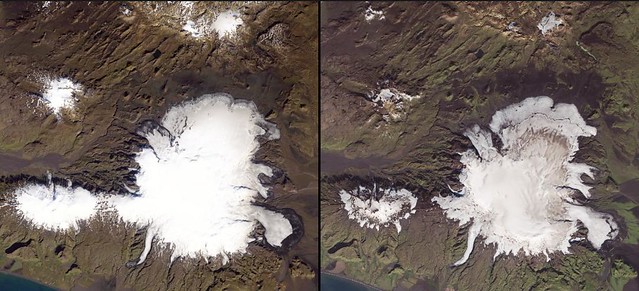
冰島上眾多的冰帽,有超過一半是在火山上或附近。 米達爾斯是冰島第四大冰帽,覆蓋在冰島南部的卡特拉火山上(左圖)。2014年的照片(右圖)顯示受到火山地熱影響,中間偏西南邊(右邊大塊)的冰帽正在消融。北邊的冰帽(左邊小塊的)因為消融而露出以前噴發的褐色的火山灰。不過冰帽消融並非都因火山地熱關係,包括米達爾斯在內的許多被監測的冰帽,從1990年代就開始縮小,大概每年消失50公尺,附近的停車場也跟著每年移動。
Shrinking Mýrdalsjökull ice cap, Iceland
September 16, 1986 – September 20, 2014
More than half of Iceland’s numerous ice caps and glaciers lie near or directly over volcanoes. Seen here is Mýrdalsjökull, Iceland’s fourth largest ice cap, which covers the Katla volcano at the country’s southern tip. In the 2014 image, the depressions at the southwest-central part of Mýrdalsjökull are ice cauldrons caused by geothermal heat from below. Along the northern part of the ice cap, ablation has exposed brown bands of ash from past eruptions. But not all of the changes are associated with volcanic activity. Most of the monitored glaciers have been shrinking since the 1990s, including Sólheimajökull (lower left), which has been retreating as much as 50 meters (164 feet) per year. A parking lot near this glacier is moved almost annually to accommodate tourists.
Images taken by the Thematic Mapper onboard Landsat 5 and the Operational Land Imager onboard Landsat 8. Source: NASA Earth Observatory, using data from the U.S. Geological Survey.
 Credit: NASA
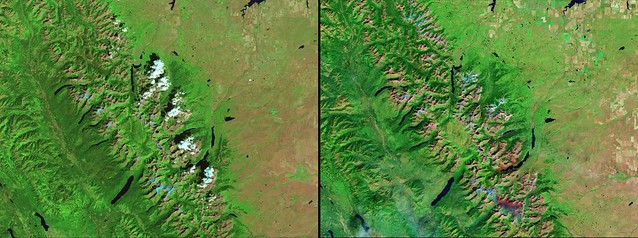
位在美國蒙大拿州洛磯山脈的冰河國家公園,其內所有的冰河可能在2030年都會消失。1850年大約有150條冰川在1968年剩下83條,到現在則只剩下25條。在這二幅假色圖像(false-color images)中藍色表示永久冰雪。黑腳傑克森盆地的冰河從1850年的21.6平方公里消退到1979年的7.4平方公里。右圖還可以看到森林野火造成的傷痕。 左圖攝於1984年8月17日,右圖攝於2015年8月23日。
Vanishing glaciers in Glacier National Park, Montana
August 17, 1984 – August 23, 2015
Glacier National Park, in Montana’s portion of the Rocky Mountains, is expected to be virtually glacier-free by around 2030. The roughly 150 glaciers it contained in 1850 dwindled to 83 by 1968 and to 25 today. The area shown here is the central portion of the park. Most of the blue bodies in these false-color images are permanent snow and ice. Glaciers in the Blackfoot-Jackson basin decreased from 21.6 square kilometers (8.3 square miles) in area in 1850 to just 7.4 square kilometers (2.9 square miles) in 1979. The 2015 image also shows burn scars from wildfires.
Images taken by the Thematic Mapper onboard Landsat 5 and the Operational Land Imager onboard Landsat 8. Source: NASA Earth Observatory.
 Credit: NASA
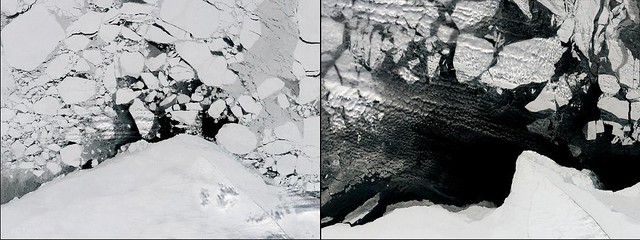
左圖是2015年4四月中旬北冰洋的波弗特海中的冰,右圖則顯現2016年4月中旬正在大量斷裂、解體,平常這情形要在五月下旬才會發生,NASA的專家認為這異常現象是因為一道滯留的高壓系統提早帶來暖空氣與強風所致。在這區域較厚的、多年的冰會季節性的消減,而第一年冰因為較薄與脆弱,在強風吹襲下很快就融解。
Early sea-ice breakup in Beaufort Sea, Arctic
April 13, 2015 – April 15, 2016
Ice in the Beaufort Sea, off the Arctic Ocean, suffered significant fracturing and breakup by mid-April in 2016, considerably earlier than the late-May period when this usually happens. NASA ice specialists attribute the change to unusually warm air temperatures during the first months of the year and to strong winds caused by a stalled high-pressure system over the area. The thicker, multi-year ice that once covered the region has largely given way to seasonal, first-year ice that is thinner, weaker and more easily broken up by strong winds.
Images taken by the Operational Land Imager onboard Landsat 8. Source: U.S. Geological Survey (USGS) Landsat Missions Gallery; “Beaufort Sea Ice Experiences Unusually Early Breakup”; U.S. Department of the Interior / USGS and NASA.
延伸閱讀:
本網誌「氣候變遷」專欄各文


謝謝賴老師提供很棒的資訊及材料!!!
氣候變遷的議題,似乎它的熱度已經在台灣逐漸消失了。
我的朋友鵬智兄維持他一貫的堅持,為地球,為人類提供一個知識份子的力量,整理出來這份生動活潑又易懂的文稿。
謝謝你,Bird!