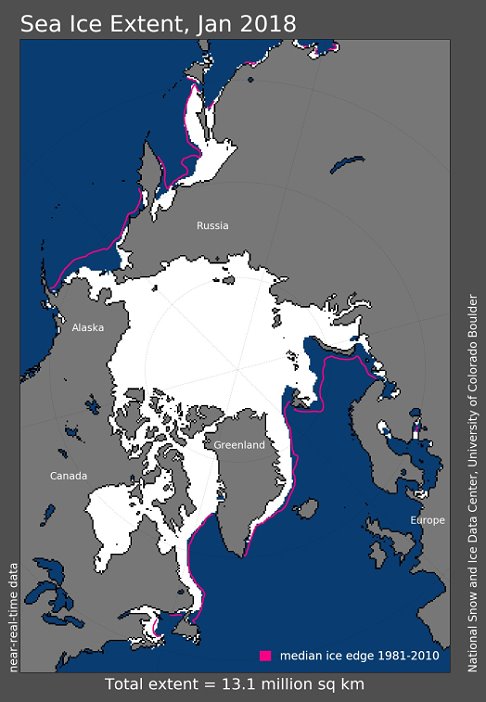
 2018年1月北極冰域平均覆蓋面積是1千3百零6萬平方公里。圖中洋紅色線是1981年至2010年的1月冰域平均面積。Arctic sea ice extent for January 2018 was 13.06 million square kilometers (5.04 million square miles). The magenta line shows the 1981 to 2010 average extent for that month. Credit:NSIDC
美國冰雪數據中心(National Snow and Ice Data Center, NSIDC)在日前的新聞指出,2018年1月是有衛星監測以來,北極冰域縮至1月紀錄新低,南極冰域則是史上第二低,而全球冰的覆蓋面積也創下最小紀錄。
2018年1月第一週,北極冰域的面積就小於2017年1月平均面積,接著冰域成長速度接近以往平均值,在一月中甚至面積大過1月平均面積,但到了月底,冰域面積又小於2017年1月平均值。
2018年1月北極冰域平均覆蓋面積是1千3百零6萬平方公里,少於1981年至2010年間的平均值約136萬平方公里,也小於2017年最小面積約11萬平方公里。
而在南極大陸,1月11日達到冰域1月面積史上第二低紀錄,史上最低紀錄是2017年1月。縮小最多的區域在羅斯海(Ross Sea)與西阿蒙森海(West Amundsen Sea),其他區域則維持在平均值左右。
 此圖呈現從1979年至2018年間,北極海冰覆蓋範圍呈現下降趨勢,平均以每年以47700平方公里(或每十年3.3%)的速度縮減。The linear rate of decline for January is 47,700 square kilometers (18,400 square miles) per year, or 3.3 percent per decade. Credit:NSIDC
南北極的冰愈來愈少,除了會使得海平面上升,將淹沒許多人類可以使用的海岸地區或小島,而且因為減少了冰對太陽輻射的反射,將使得地球蓄積的熱能增加而增強溫室效應,於是極端氣候會更形顯著,自然生態與人類生產、生活都會遭受極大威脅或損失。不要以為南北極離臺灣很遠,它們每天的變化,都帶動著你我的命運前進,現在就看大家要用怎樣的生活方式與態度,面對這麼不樂觀的變局!
以下是新聞原文:
Sea ice tracking low in both hemispheres
20180206
January of 2018 began and ended with satellite-era record lows in Arctic sea ice extent, resulting in a new record low for the month. Combined with low ice extent in the Antarctic, global sea ice extent is also at a record low.
The new year was heralded by a week of record low daily ice extents, with the January average beating out 2017 for a new record low. Ice grew through the month at near-average rates, and in the middle of the month daily extents were higher than for 2017. However, by the end of January, extent was again tracking below 2017. The monthly average extent of 13.06 million square kilometers (5.04 million square miles) was 1.36 million square kilometers (525,000 square miles) below the 1981 to 2010 average, and 110,000 square kilometers (42,500 square miles) below the previous record low monthly average in 2017.
Antarctic sea ice also low, leading to low global sea ice extent
In the Southern Hemisphere, after January 11 sea ice began tracking low, leading to a January average extent that was the second lowest on record. The lowest extent for this time of year was in 2017. Extent is below average in the Ross Sea and the West Amundsen Seas, while elsewhere extent remains close to average. The low ice extent is puzzling, given that air temperatures at the 925 hPa level are near average or below average (relative to the 1981 to 2010 period) over much of the Southern Ocean. The Weddell and Amundsen Seas were 1 to 2 degrees Celsius (2 to 4 degrees Fahrenheit) below average. Slightly above-average temperatures were the rule in the northwestern Ross Sea.
後記:
2018年2月15日,美國航空暨太空總署(NASA)公布2018年1月是有現代分析138年來的第五高溫紀錄(January 2018 was fifth warmest January on record)。
 全球陸地與海洋溫度與1951-1980年間平均值相較圖,愈紅升溫愈高。 2018年1月A global map of the January 2018 LOTI (land-ocean temperature index) anomaly, relative to the 1951-1980 January average.
January 2018 was the fifth warmest January in 138 years of modern record-keeping, according to a monthly analysis of global temperatures by scientists at NASA’s Goddard Institute for Space Studies (GISS) in New York. It was cooled somewhat by the current La Niña phase of the El Niño-Southern Oscillation.
Last month was +0.78°C warmer than the average January of the 1951-1980 period. The only months of January warmer than that occurred in 2016 (+1.16°C), 2017 (+0.97°C), 2007 (+0.95°C), and in 2015 (+0.81°C). The East Coast of North America was cooler than normal — 1-2°C below the 1951-1980 mean — whereas the rest of the continent was about 5°C warmer than that period.
 歷年各月氣溫變化圖 The GISTEMP monthly temperature anomalies superimposed on a 1980-2015 mean seasonal cycle.
The monthly analysis by the GISS team is assembled from publicly available data acquired by about 6,300 meteorological stations around the world, ship- and buoy-based instruments measuring sea surface temperature, and Antarctic research stations.
The modern global temperature record begins around 1880 because previous observations didn’t cover enough of the planet. Monthly analyses are sometimes updated when additional data becomes available, and the results are subject to change.
延伸閱讀:
NASA:2017年是史上第二熱 50秒看地球138年逐漸發燒狀況(影片)
北極急速解凍 氣候問題嚴重—2017年地球發燒與北極冰況總檢視(數據、圖片、影片)-中英對照
2016年史上最熱,48秒影片看地球137年逐漸發燒狀況(含2016年全球氣候報告)
北極冰融得更快了—2016年地球發燒與北極冰況總檢視(數據、圖片、影片)
20150225北極冬季海冰最大覆蓋面積創歷史新低(影片與圖表)


為世世代代子孫著想,力行節能減碳